Ecowitt WS90 in Home Assistant and posting data to weather services
Ecowitt WS90 (specifically, the one powered by Shelly) is a Zigbee-enabled personal weather station (PWS), which easily integrates with Home Assistant.
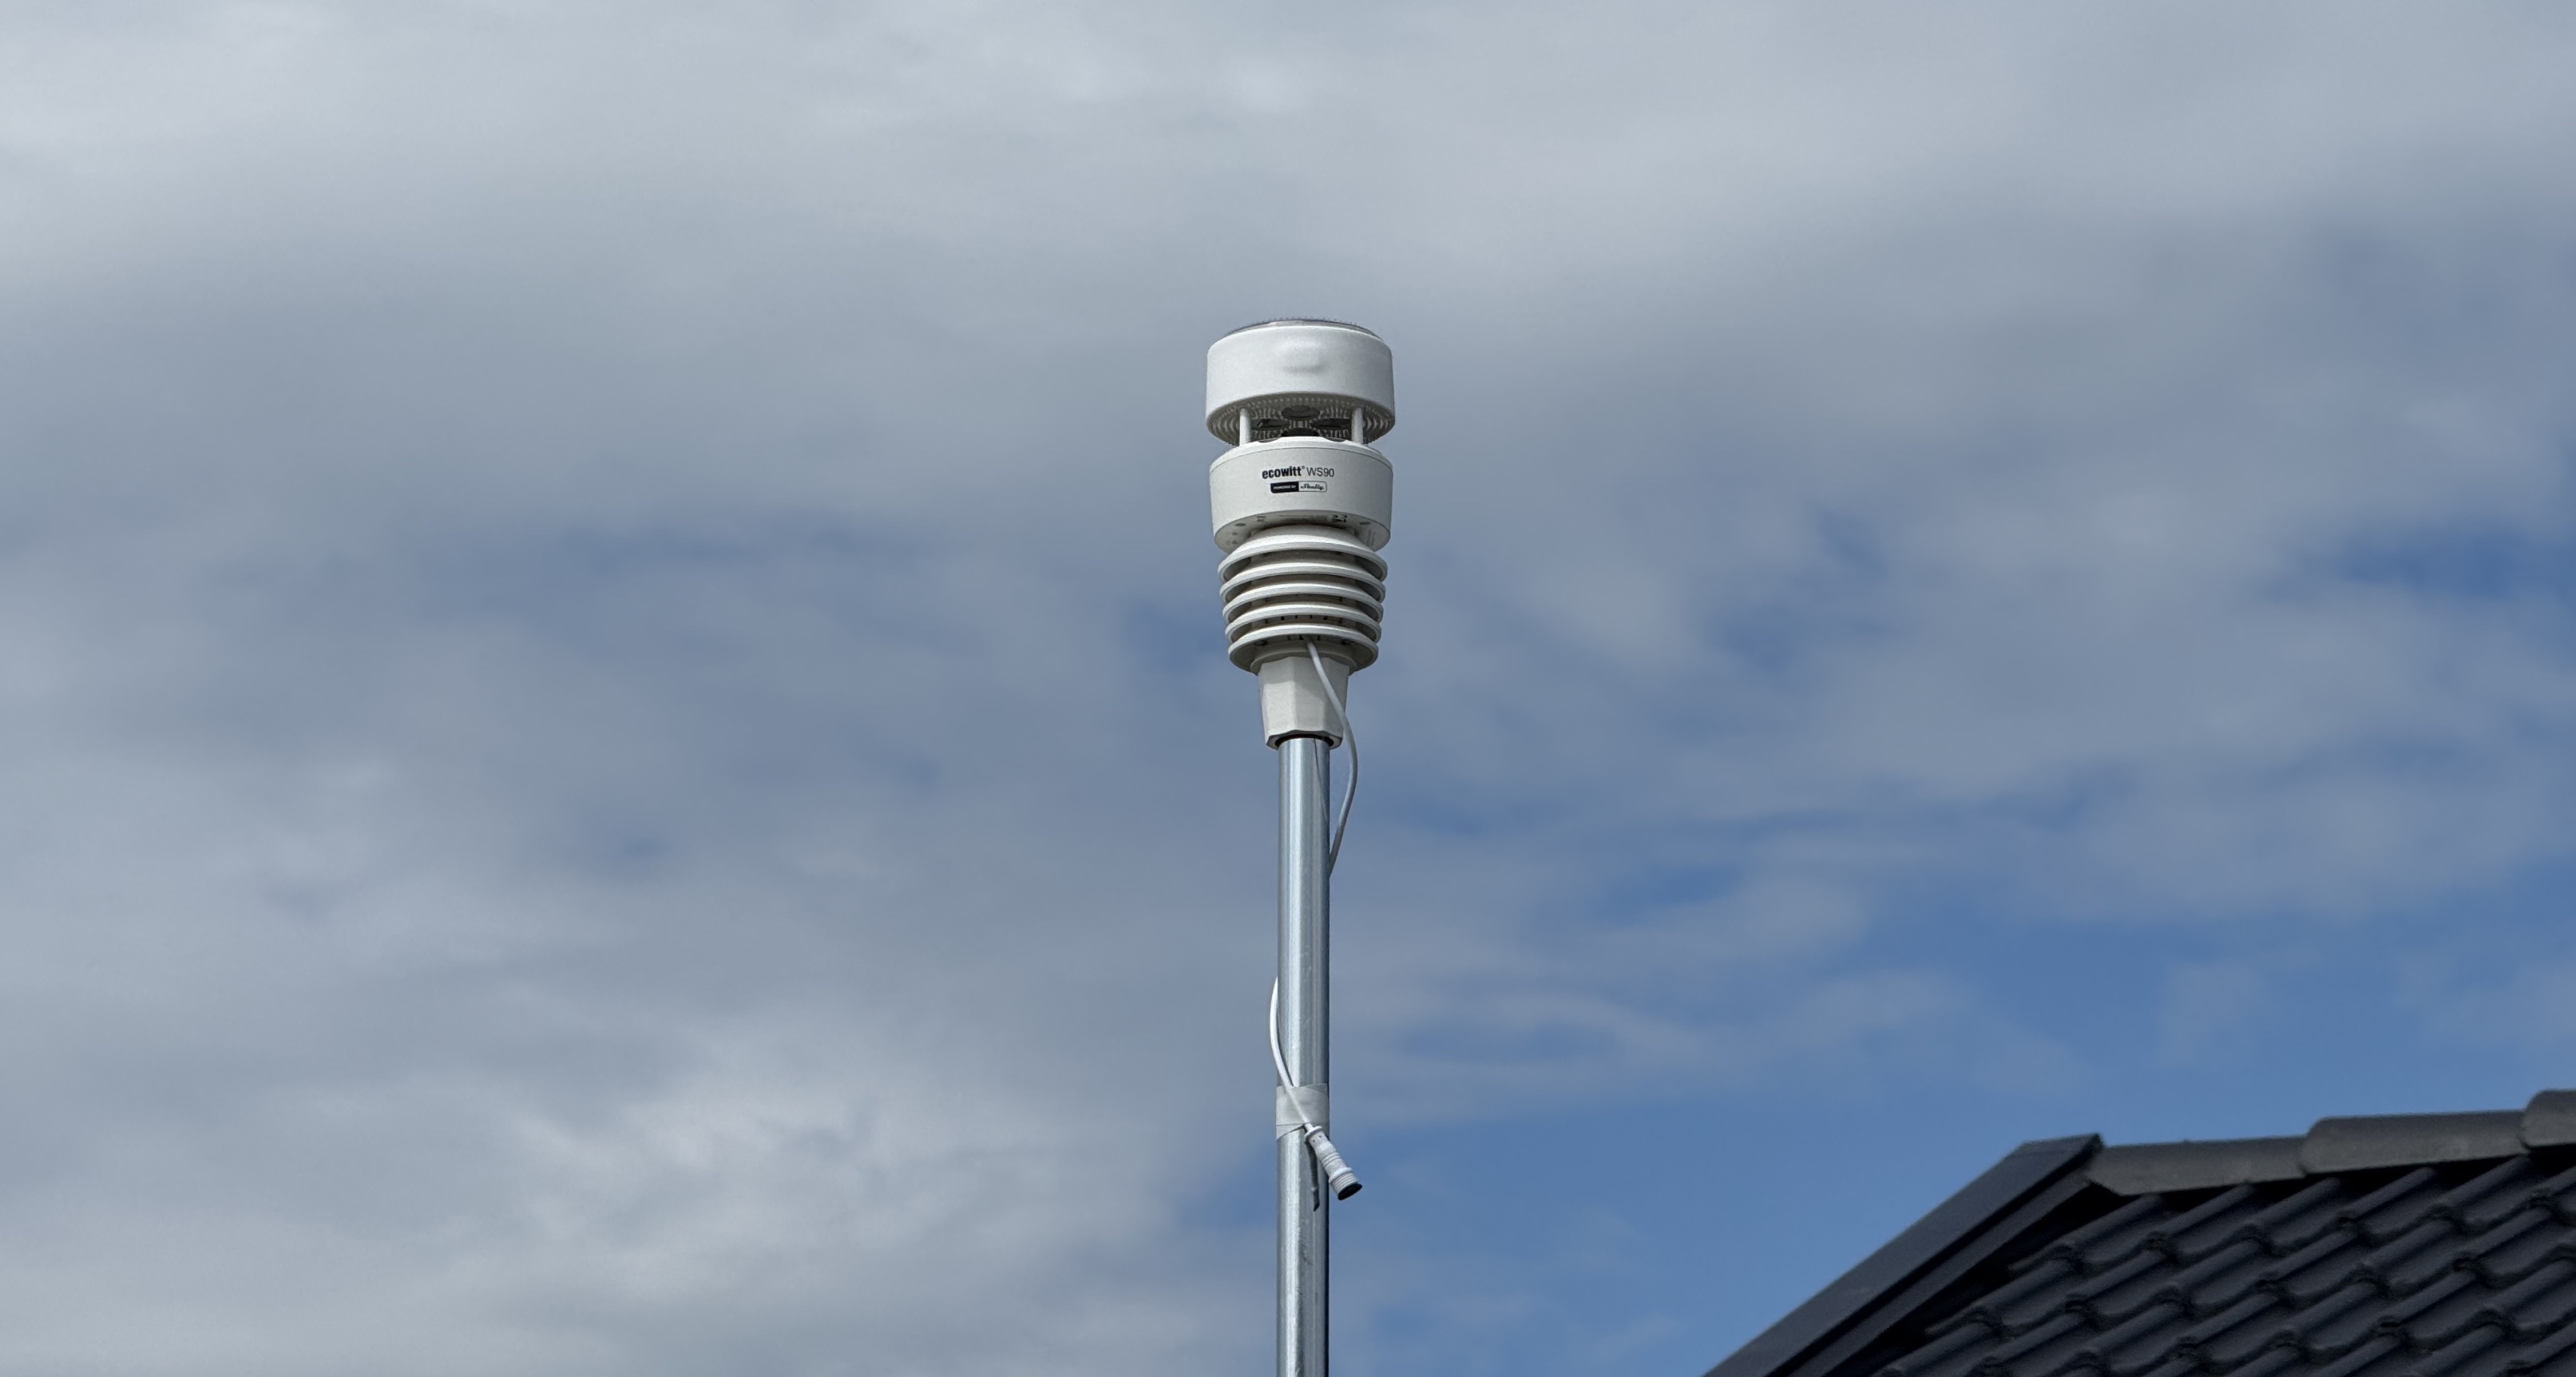
In addition to using its weather data for your own dashboards and automations, you can also share it with online public weather services.
The station
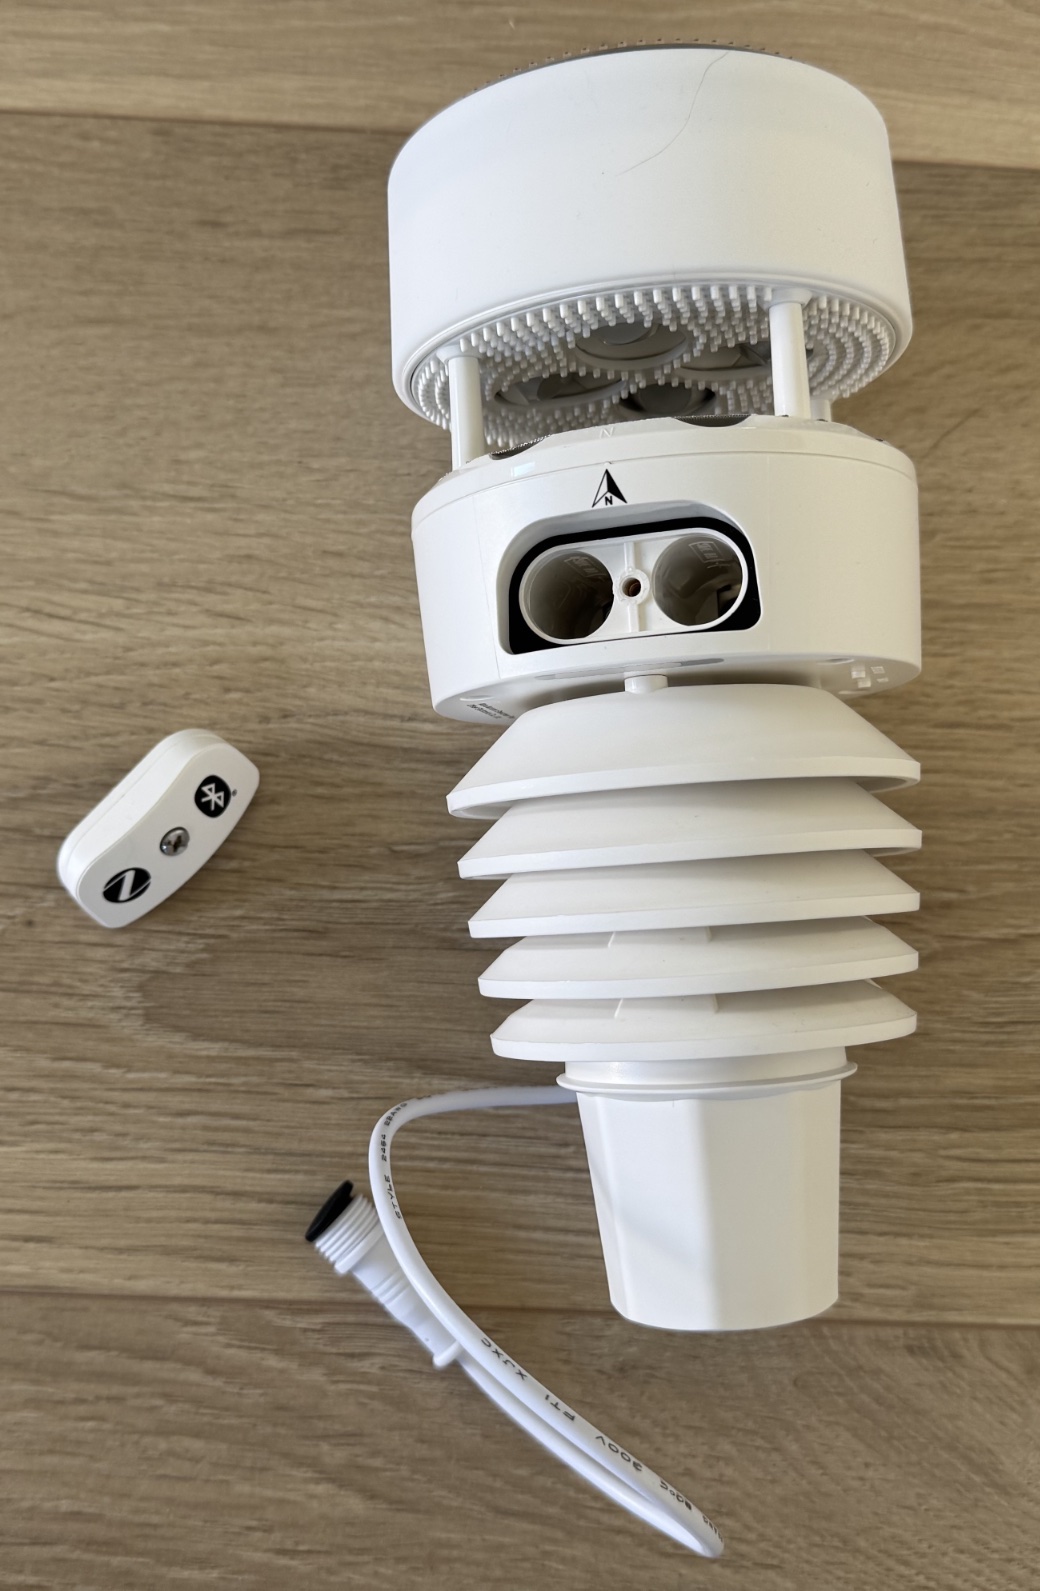
It looks like this:
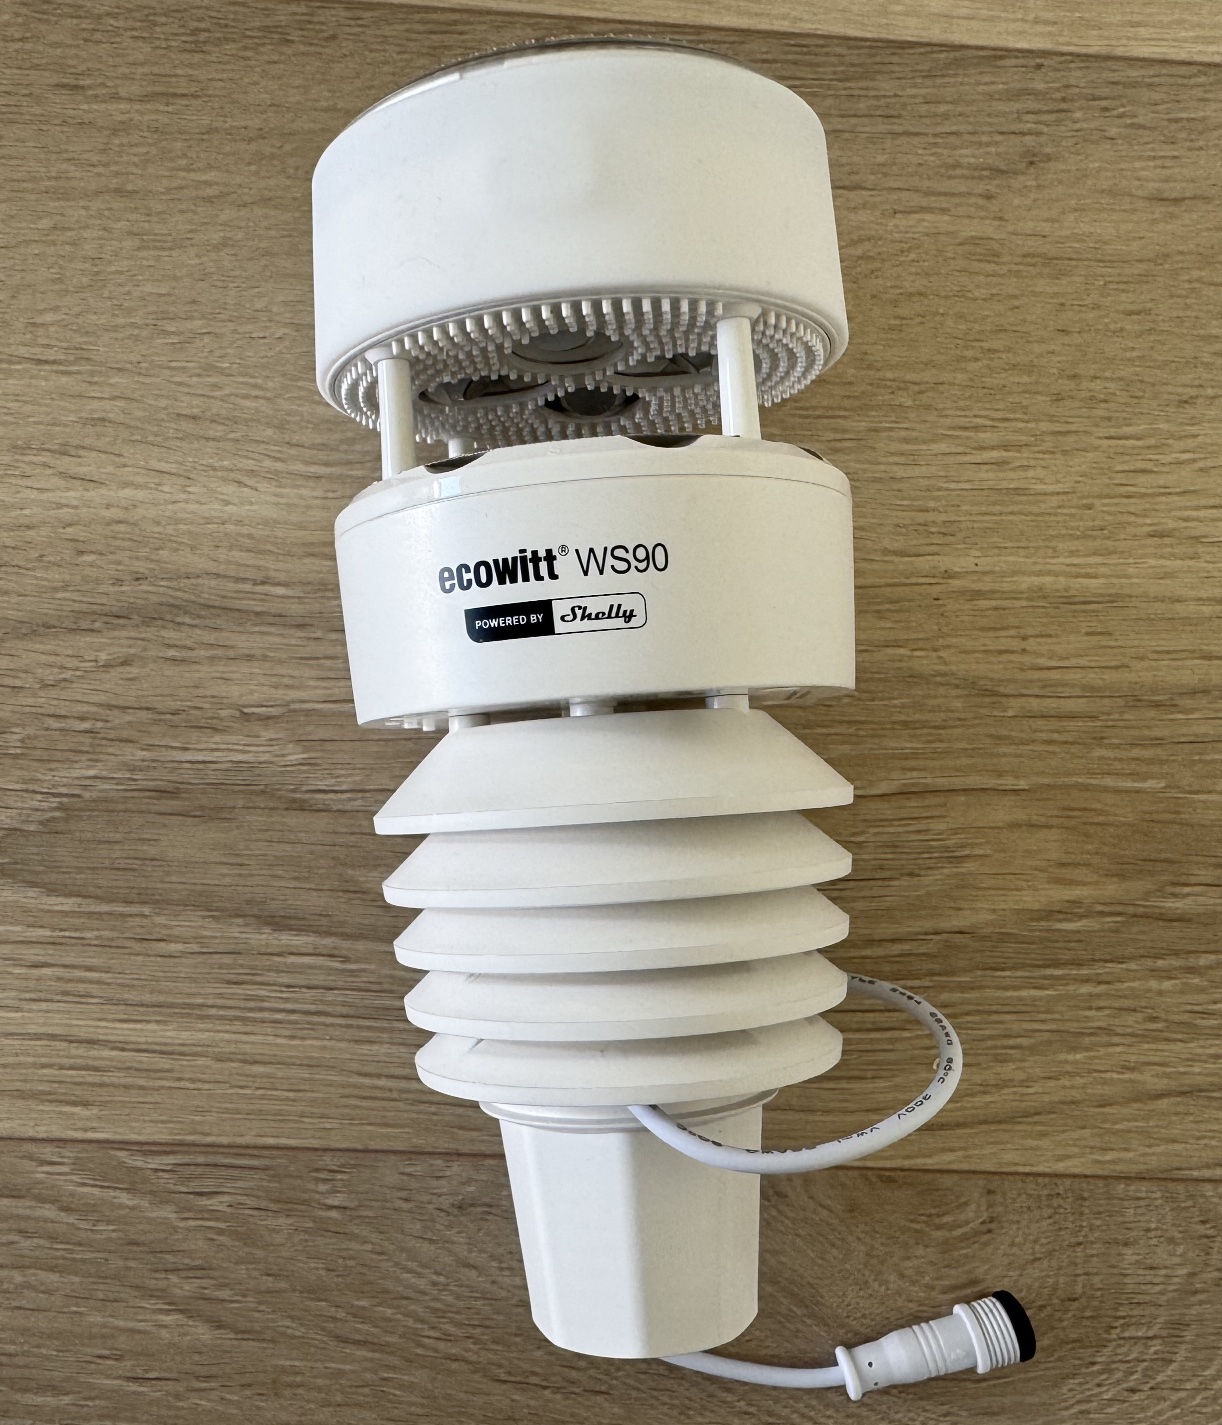
As you can see, it is rather monolithic and has no moving parts, so even the wind speed is measured with some black magic (ultrasonic anemometer) instead of the usual rotating anemometer with cups.
One thing you might worry about is birds landing on the top and messing with the sensors measurements, and for that Ecowitt sells this spikes accessory (10 USD), but I haven’t got one yet.
What exactly does Shelly power in it
Unlike the default/original Ecowitt WS90, which openly transmits the data via Sub-GHz radio frequency (so anyone in range can receive it), the one powered by Shelly uses Zigbee or/and(?) Bluetooth (so it requires pairing). That difference also makes it incompatible with other Ecowitt devices such as display panels (because they too work via that open radio broadcast), but I don’t care about those. The Shelly variant also costs more than the default one - about 30 USD more expensive.
Both Zigbee and Bluetooth are clearly marked on the station body:
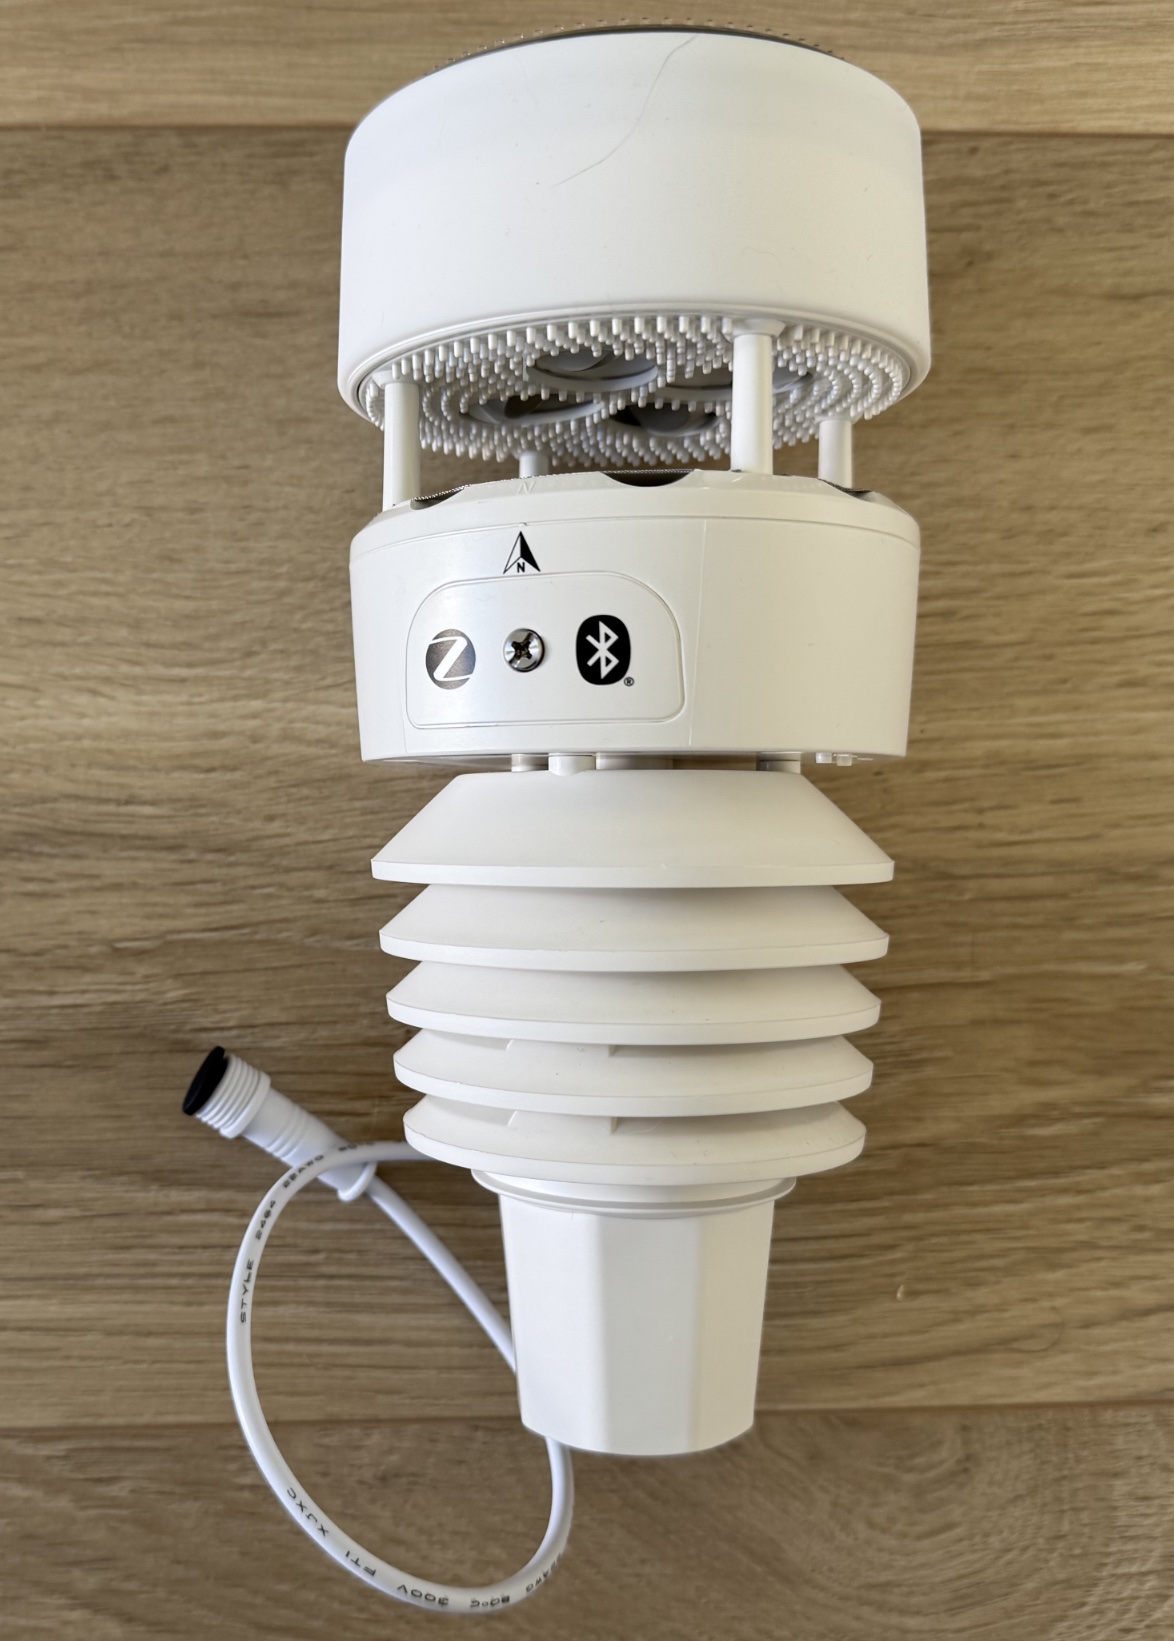
Zigbee in particular makes it trivial to integrate the station into Home Assistant (assuming that you already have a Zigbee network at your home), so for me that was an ideal scenario.
Batteries
The station is powered by solar energy, and it likely will be able to function without batteries, as apparently it is also capable of accumulating certain amount of solar energy for using it at night. But in case you don’t have a lot of sun in your area, it does also have an option of being powered by 2 AA batteries.
The batteries are recommended/required to be lithium batteries, so not NiMH or alkaline. As one user shared here, his NiMH batteries died within a few days of -5°C outside, while they were at 100% of charge for several months before. I followed his advice and bought these Varta Ultra Lithium batteries (about 13 USD):
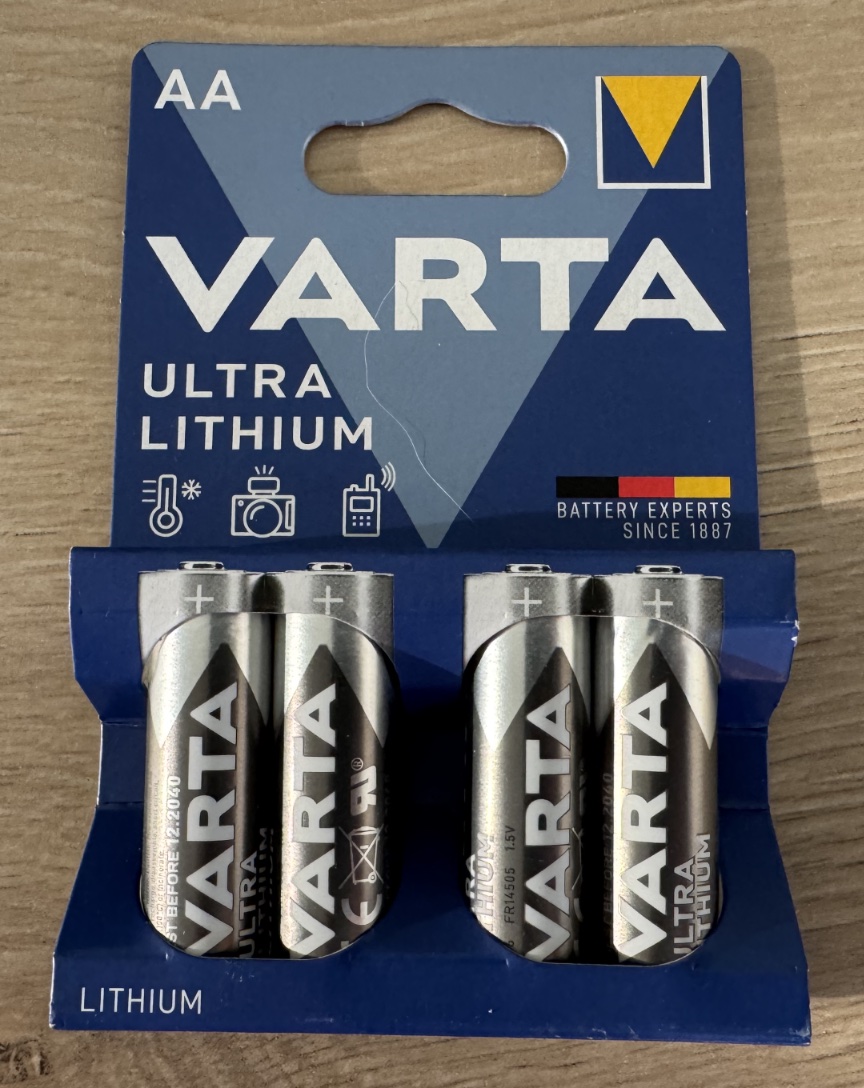
Station only needs two:
There is also a power adapter (50 USD) for enabling the integrated heater (and powering the station), which is supposed to be melting snow/ice on the station body in winter (which is a problem at least for wind sensors), but I am not sure yet whether I need it or not, I guess we’ll see in winter. By the way, the heater is another reason to avoid alkaline batteries, as they might overheat, leak and cause some damage.
Updating firmware
As usual, first thing you do with a new device is update its firmware. For this device the process is not very trivial/obvious, mainly because it is not documented anywhere (I failed to find anything). It is also worth to mention that you should perform the updating rituals before you mount the station at its permanent place (which could be somewhere on a house roof), because these rituals involves pressing a physical button on the station’s body.
Shelly’s own manual points to their Shelly Smart Control application, which requires creating an account, and that didn’t look right. I don’t need no bloody account, I just want to update the firmware and get my raw sensors data. Perhaps this application does in fact provide functionality for updating the firmware, but I never proceeded with creating an account, so I don’t know. Instead I discovered that there is this Shelly BLE Debug application, which simply works and does not require creating accounts or any other bullshit.
To connect to your device, after you’ve put the batteries in, press the CAL button once:

It will enter Bluetooth pairing mode, and then you should be able to connect to it in the application:
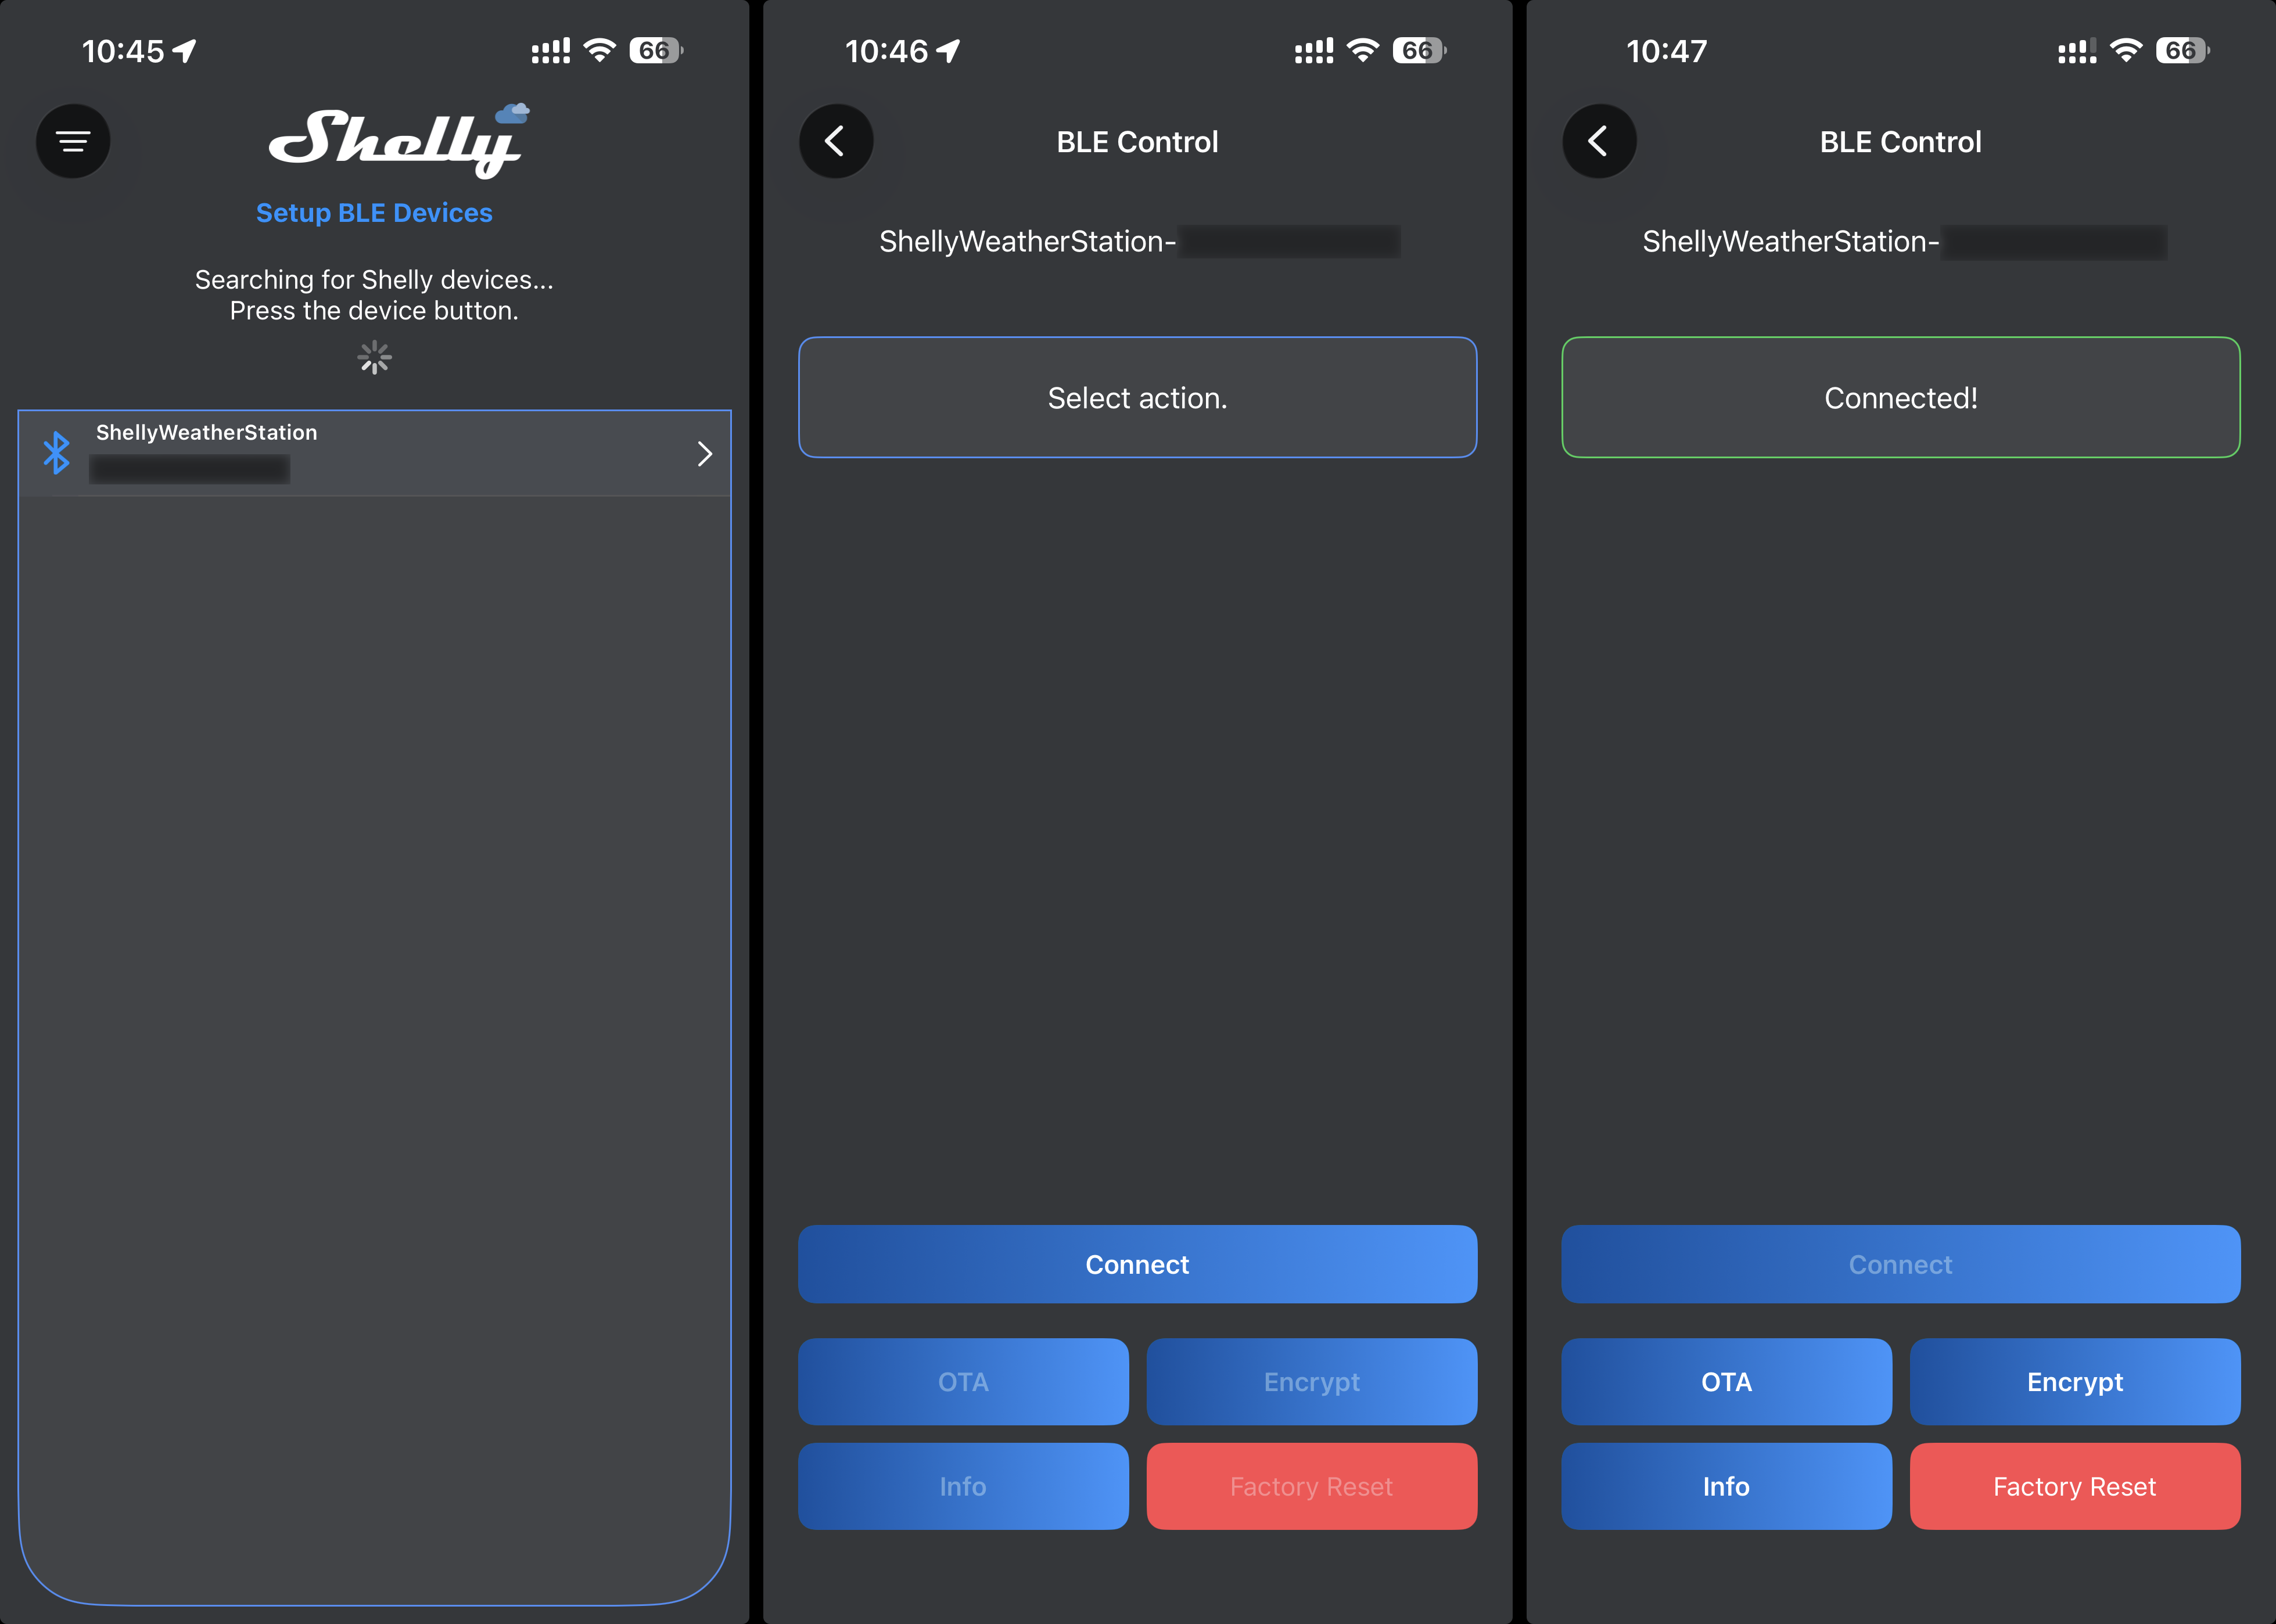
Once connected, you can read some device information by pressing Info button:
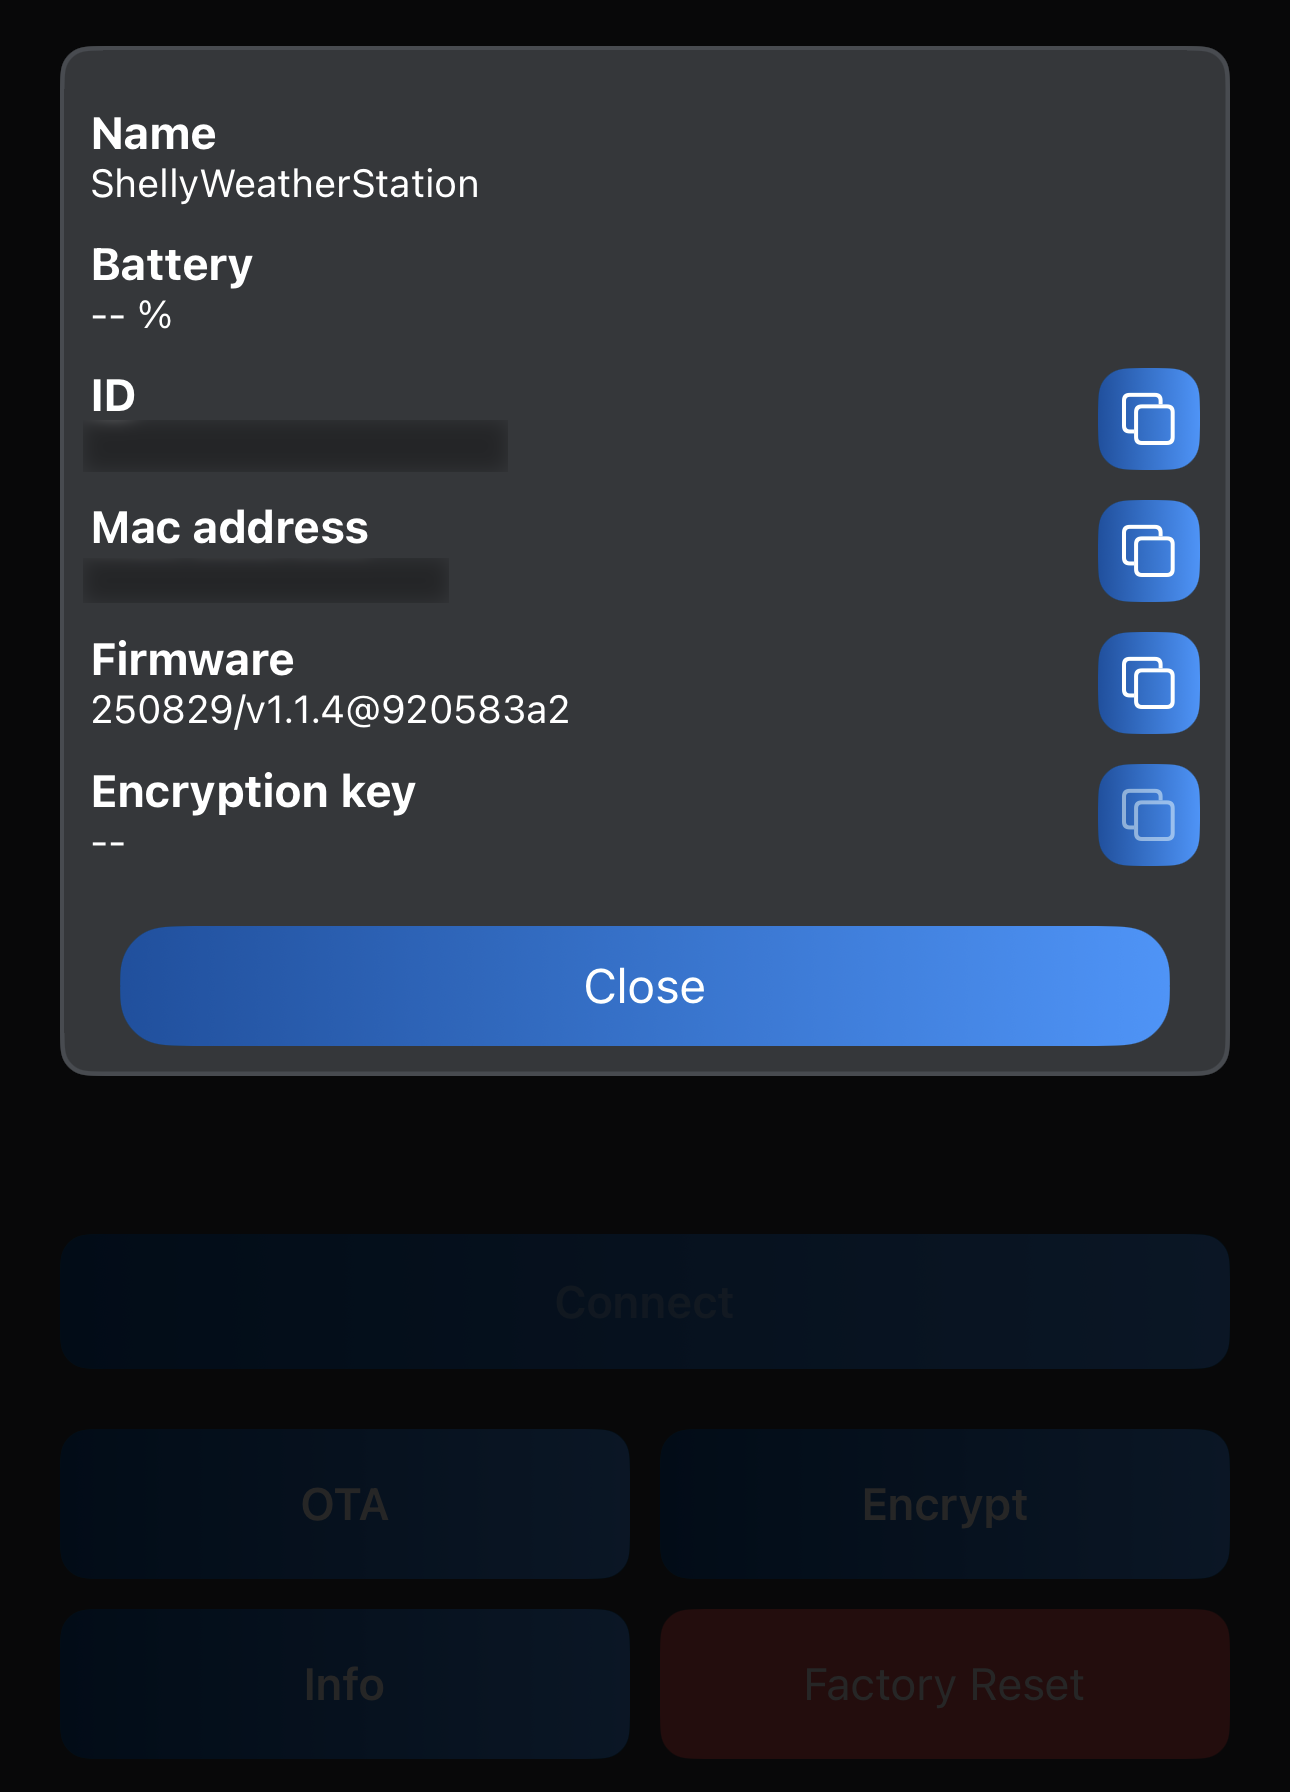
and check the firmware status by pressing OTA button:
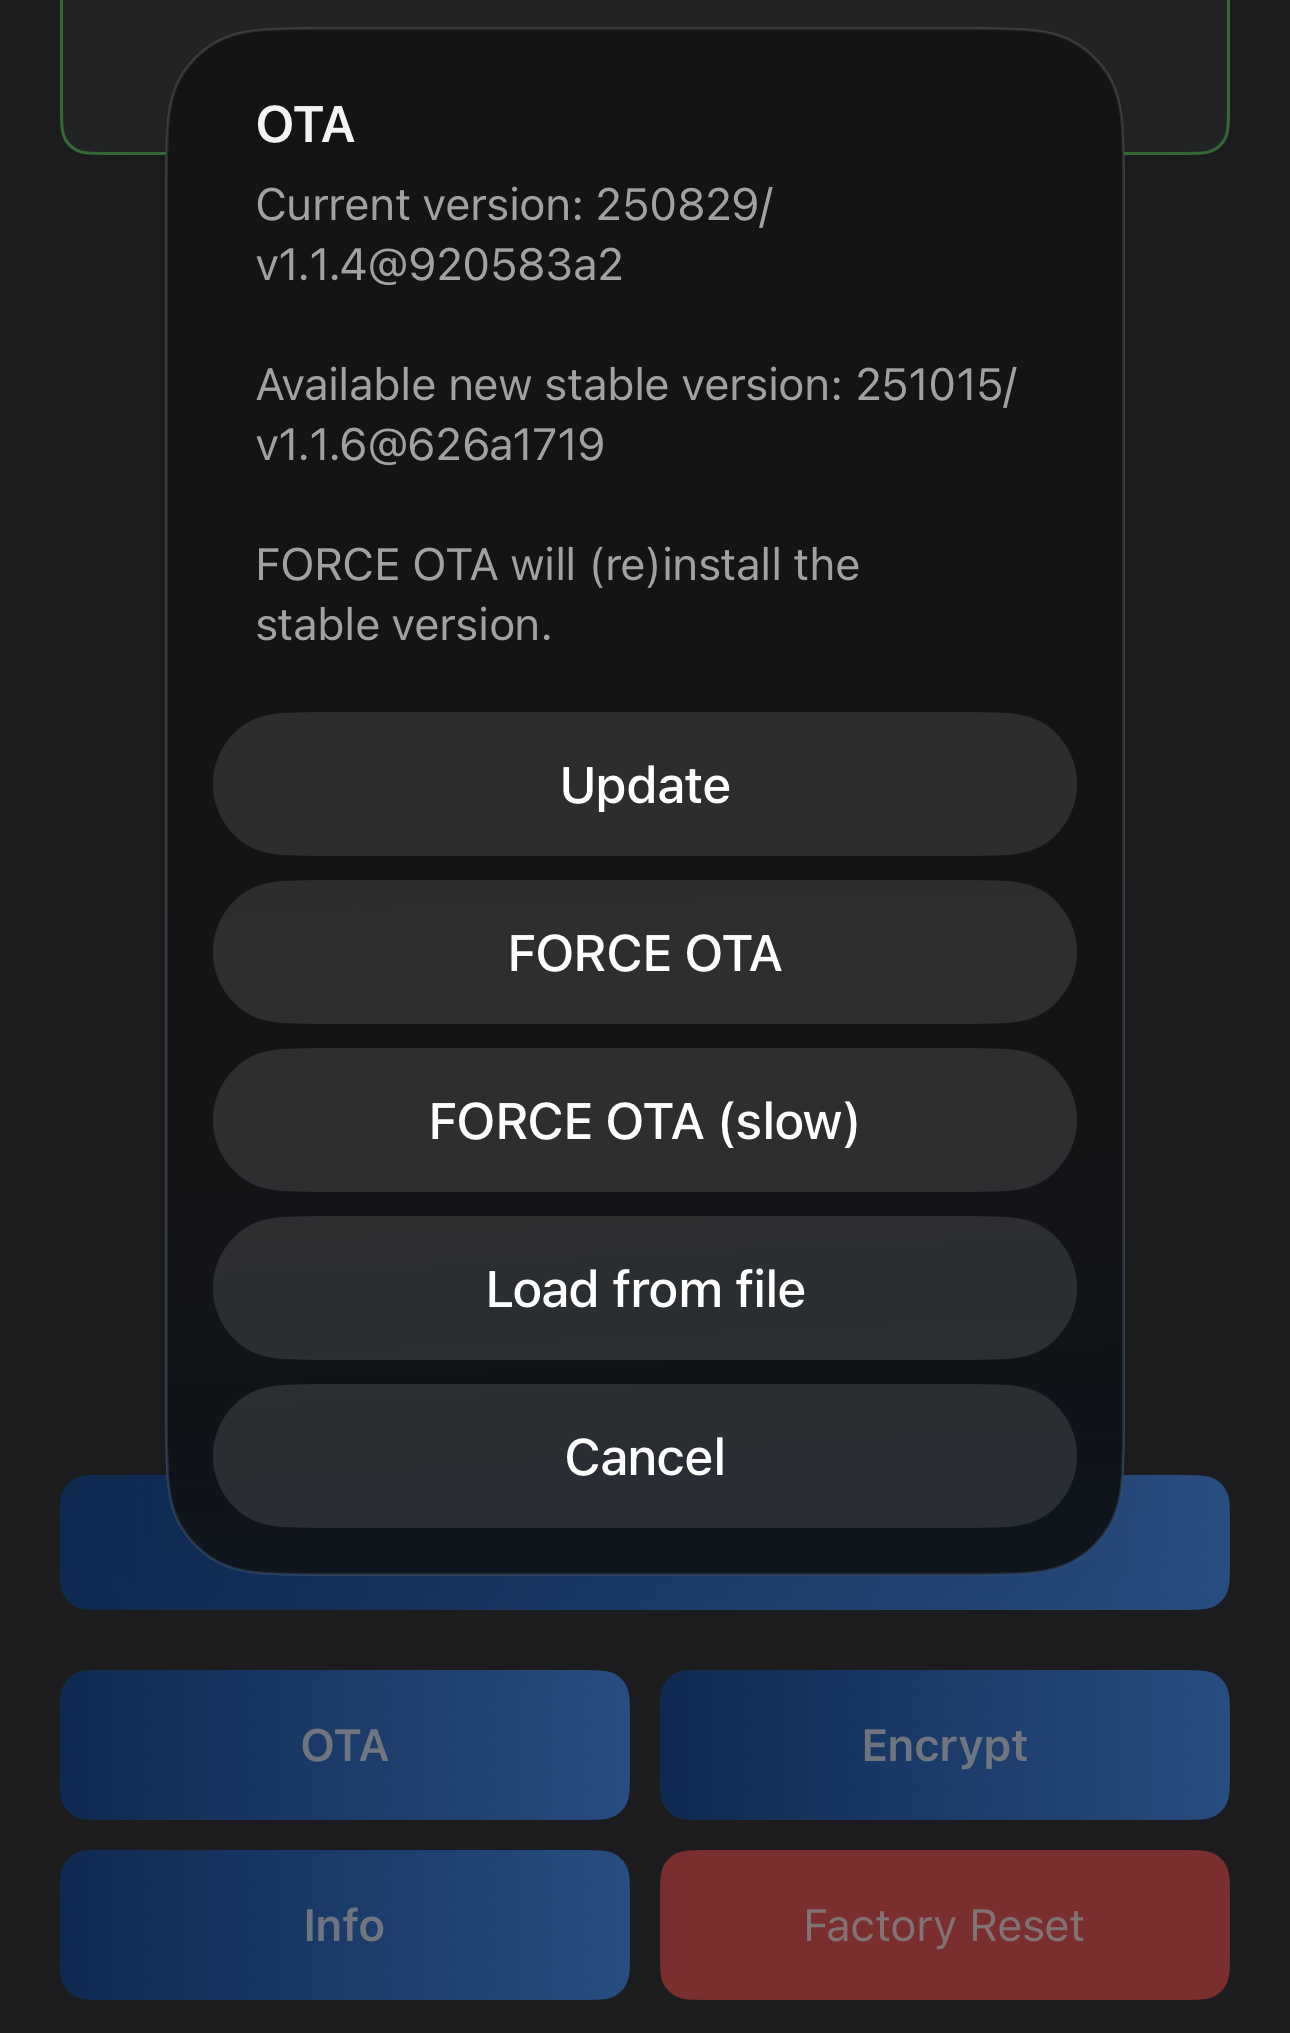
When I first tried starting the update (by pressing Update button), it got stuck on the very first stage of “preparing”:
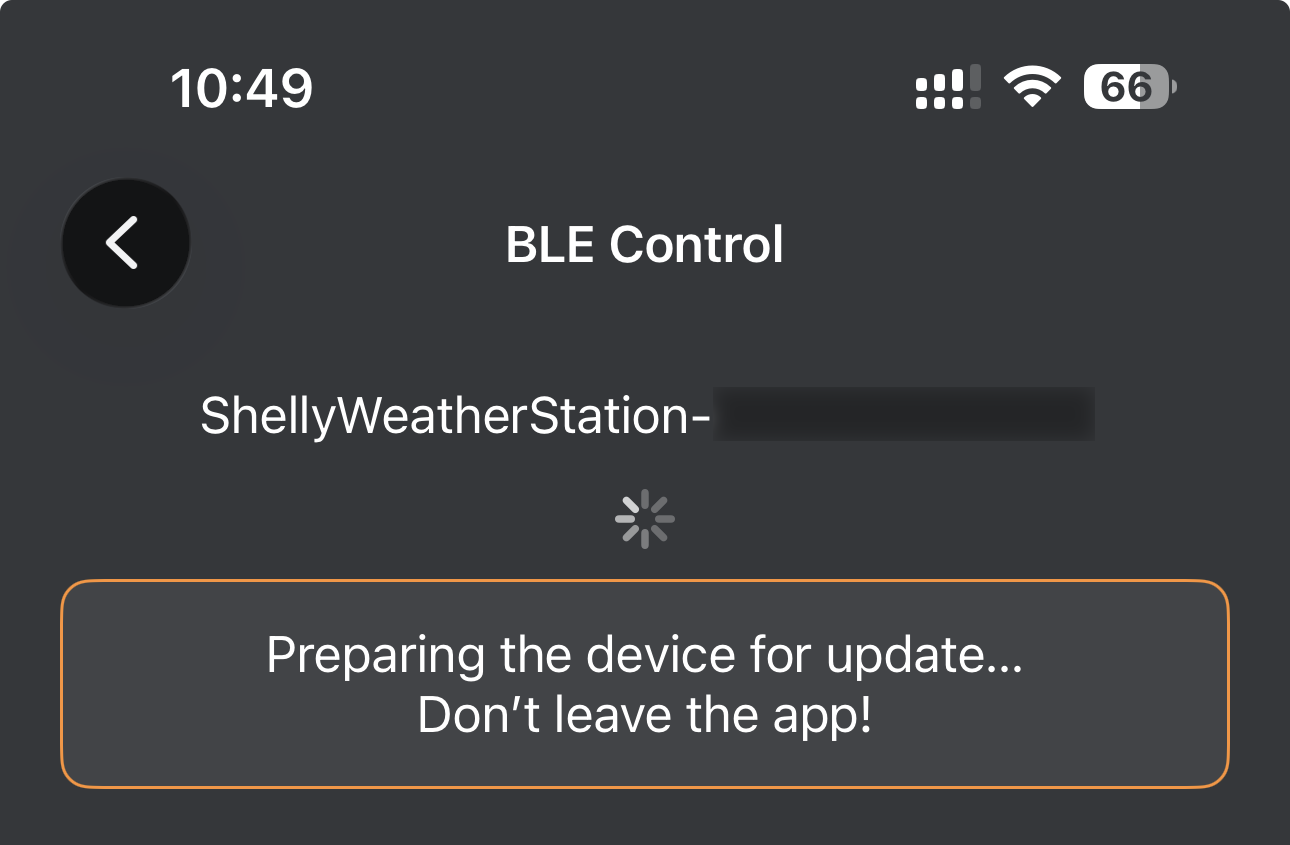
I was waiting for a long time (more than 5 minutes or even longer?), but it never progressed any further. So then I relaunched the application and tried again, and this time it went fine right away and was done in about a minute:
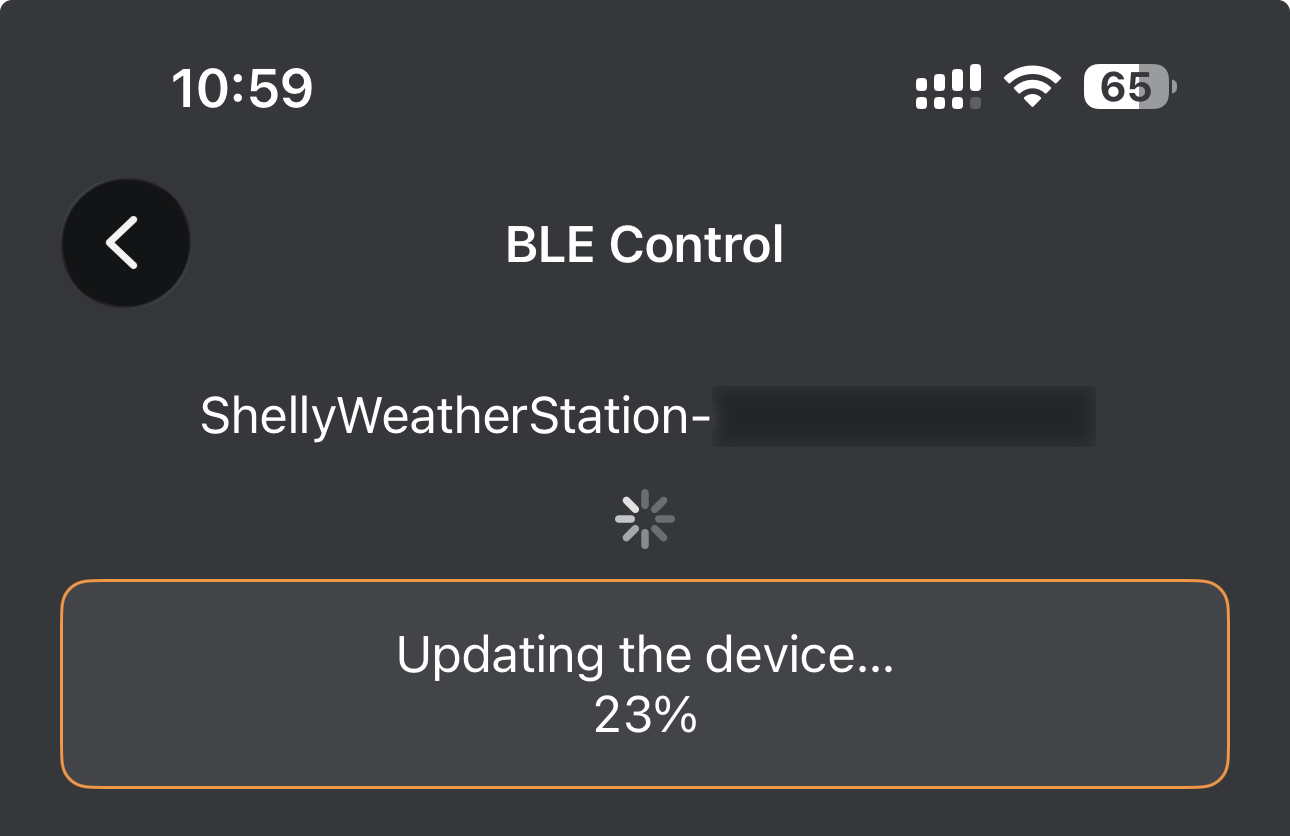
Checking the update status now shows that I have the latest version:
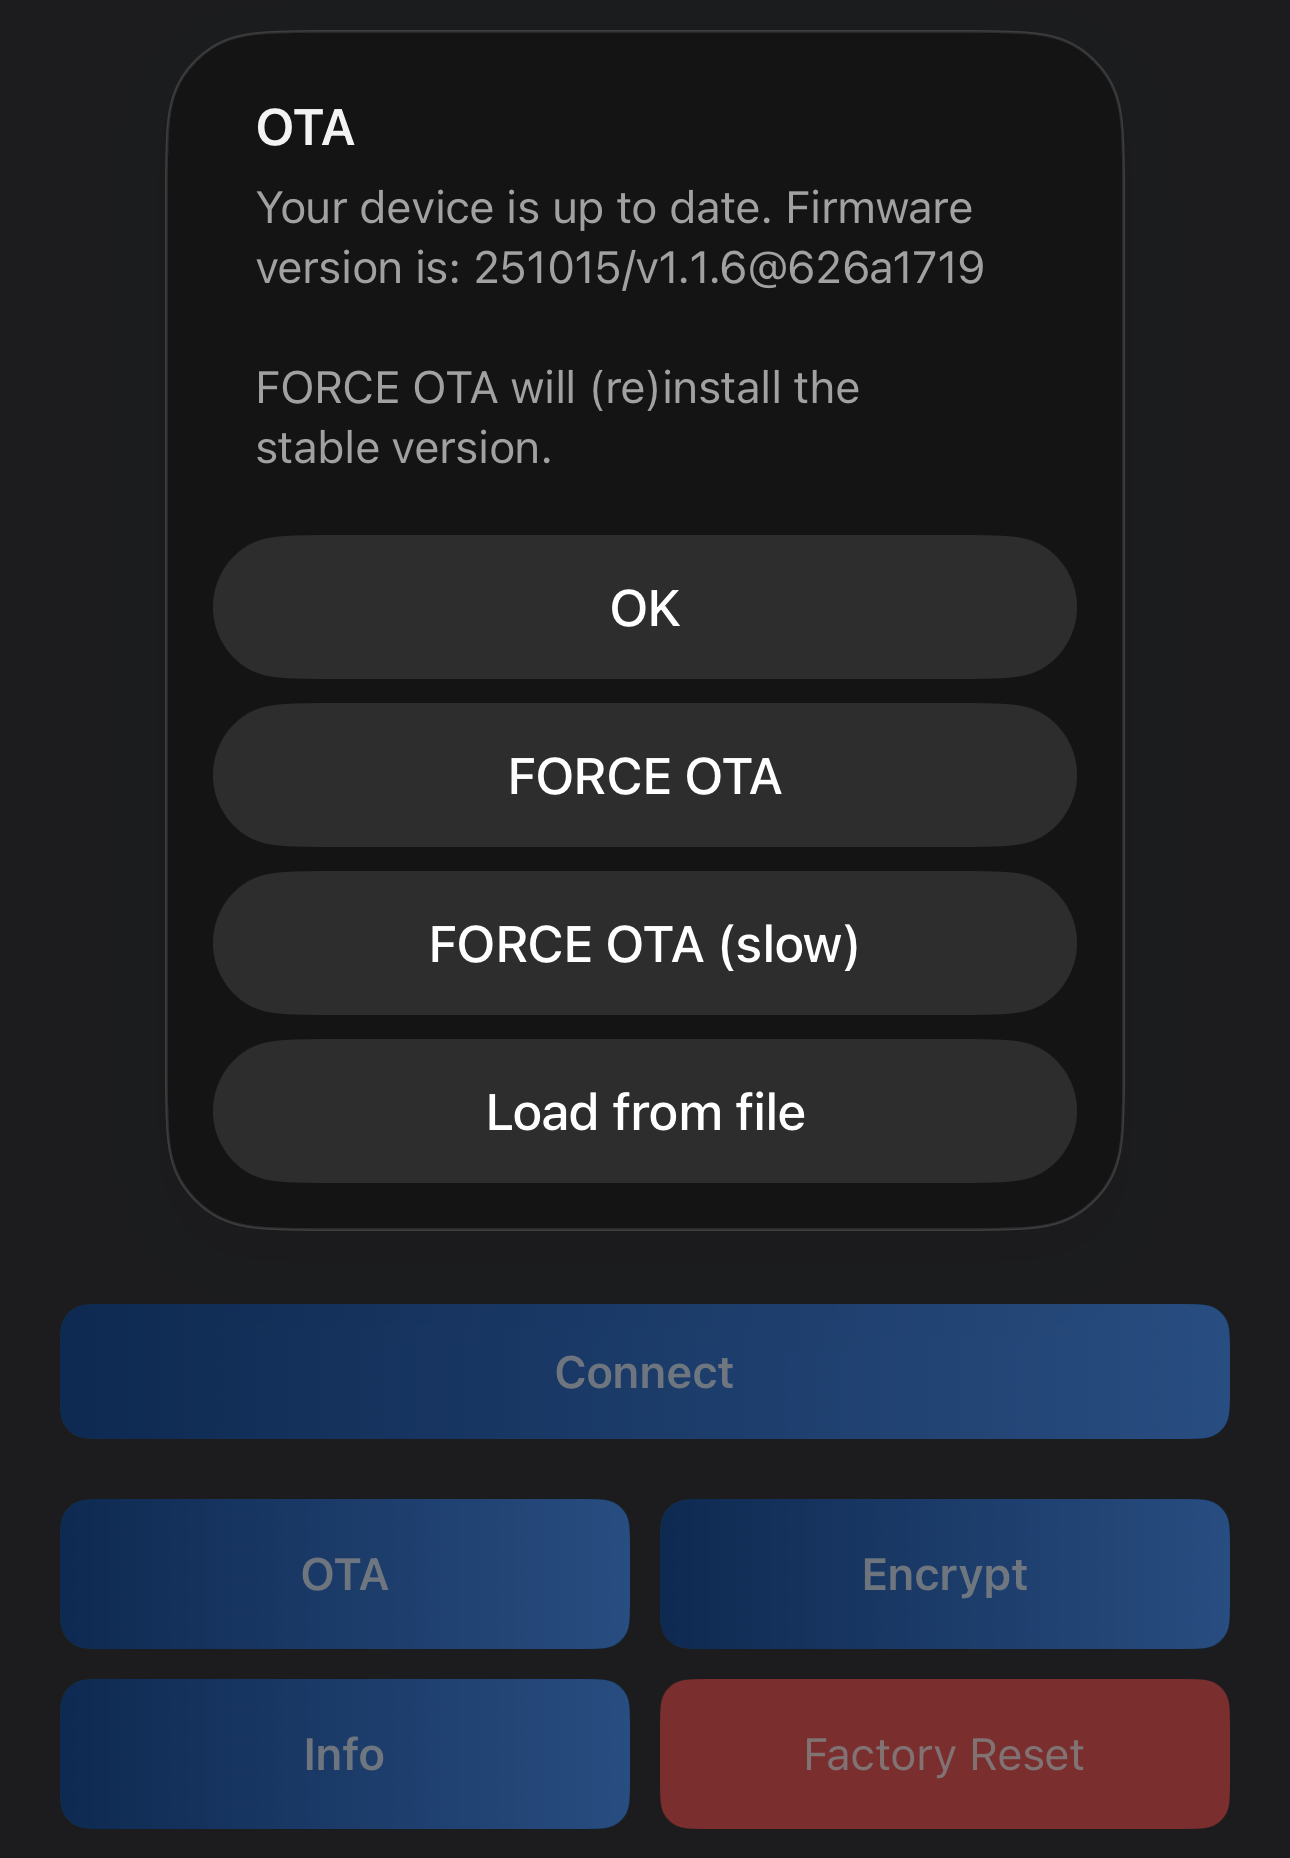
It would be nice to subscribe to some newsletter or, better yet, an RSS feed with firmware updates, so one could know when a new version becomes available, but I didn’t find any such feed or newsletter. Apparently, one is supposed to manually query for updates with Shelly BLE Debug application from time to time, which requires pressing physical button on the station body, so not the best possible user experience.
At the very least, I wanted to read the firmware changelogs for released versions, but I did not find those either. There is this page on Ecowitt website, but the Firmware Release Notes document lists versions that do not match the versions shown in Shelly BLE Debug application. There is also this changelog on Shelly’s website, but I don’t see anything related to the weather station there. Sadge.
Mounting station on a pole
As I mentioned already, before you proceed with mounting your weather station at its permanent place, first update the firmware to the latest version and then make sure that communication with Home Assistant works fine too.
The station is meant to be mounted on a pole with a diameter of 25 mm:
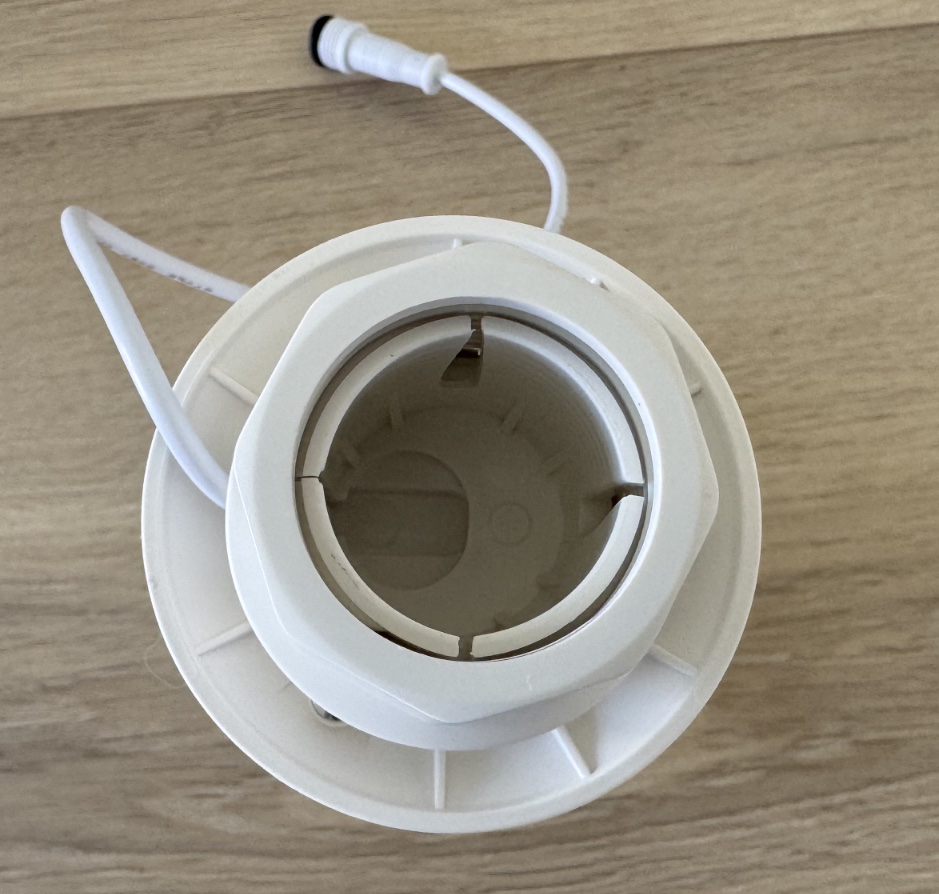
And I had no idea where can I get such a thing. These are probably available in building/construction stores, but I couldn’t find it in my local ones. What I did find is this wardrobe rail (5 USD) for hanging clothes and these mounting holders (10 USD) for it:
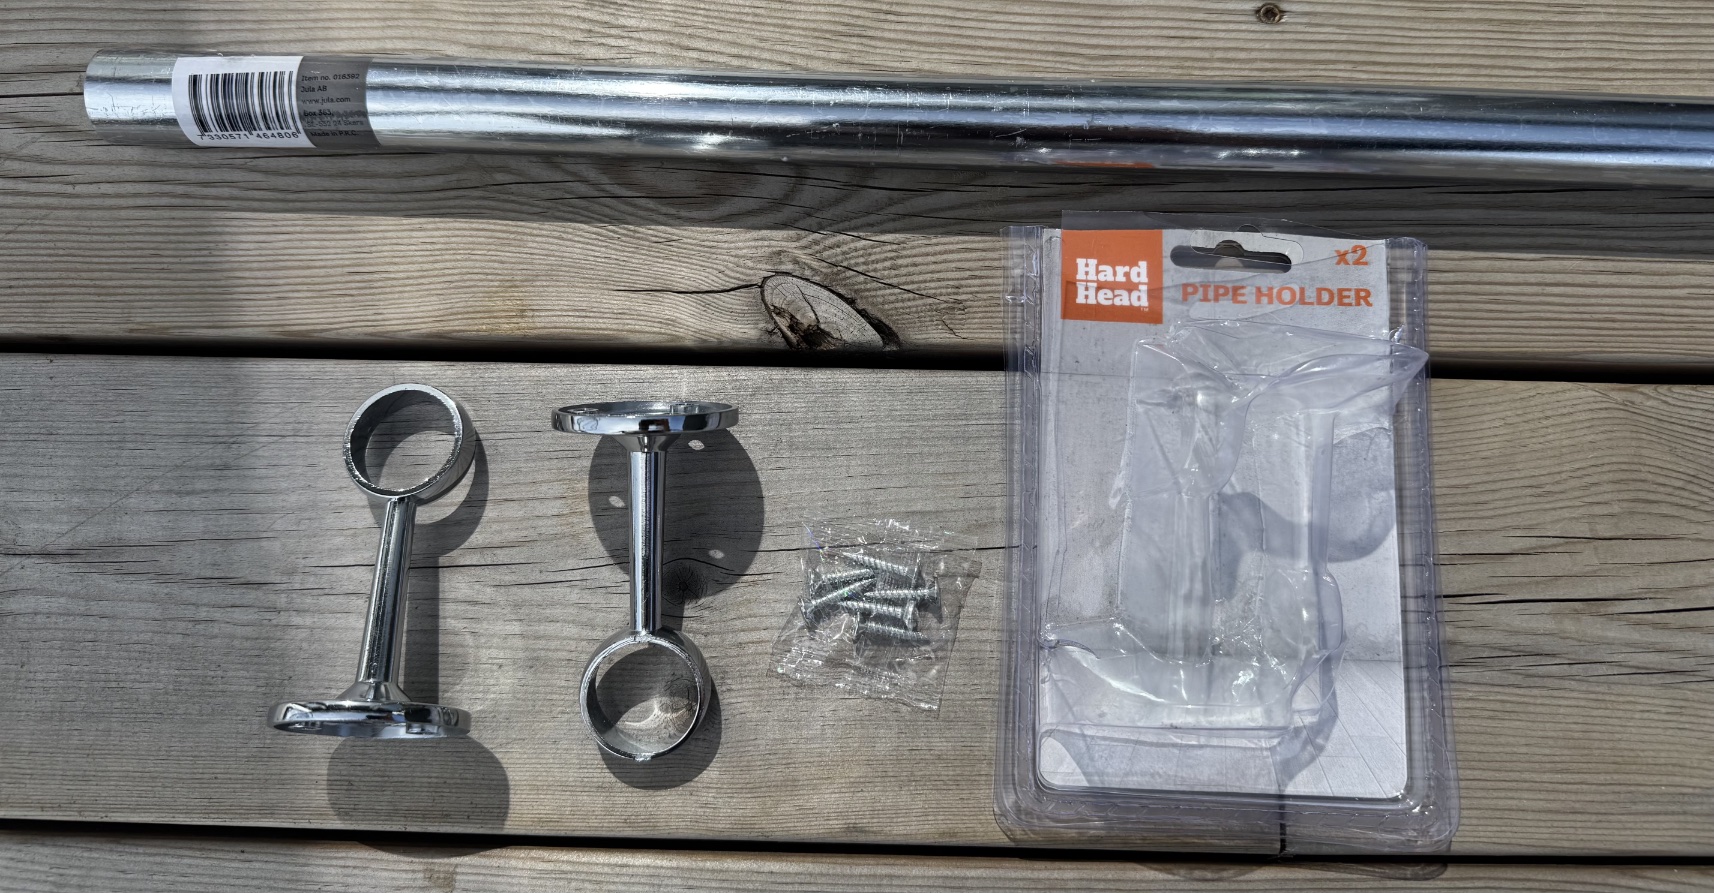
To put them all together (as it would be mounted vertically, not horizontally) the best I could come up with was to use a universal tape like this:

And the other end of the pole goes up the weather station’s arse (やめてください!(>_<)):
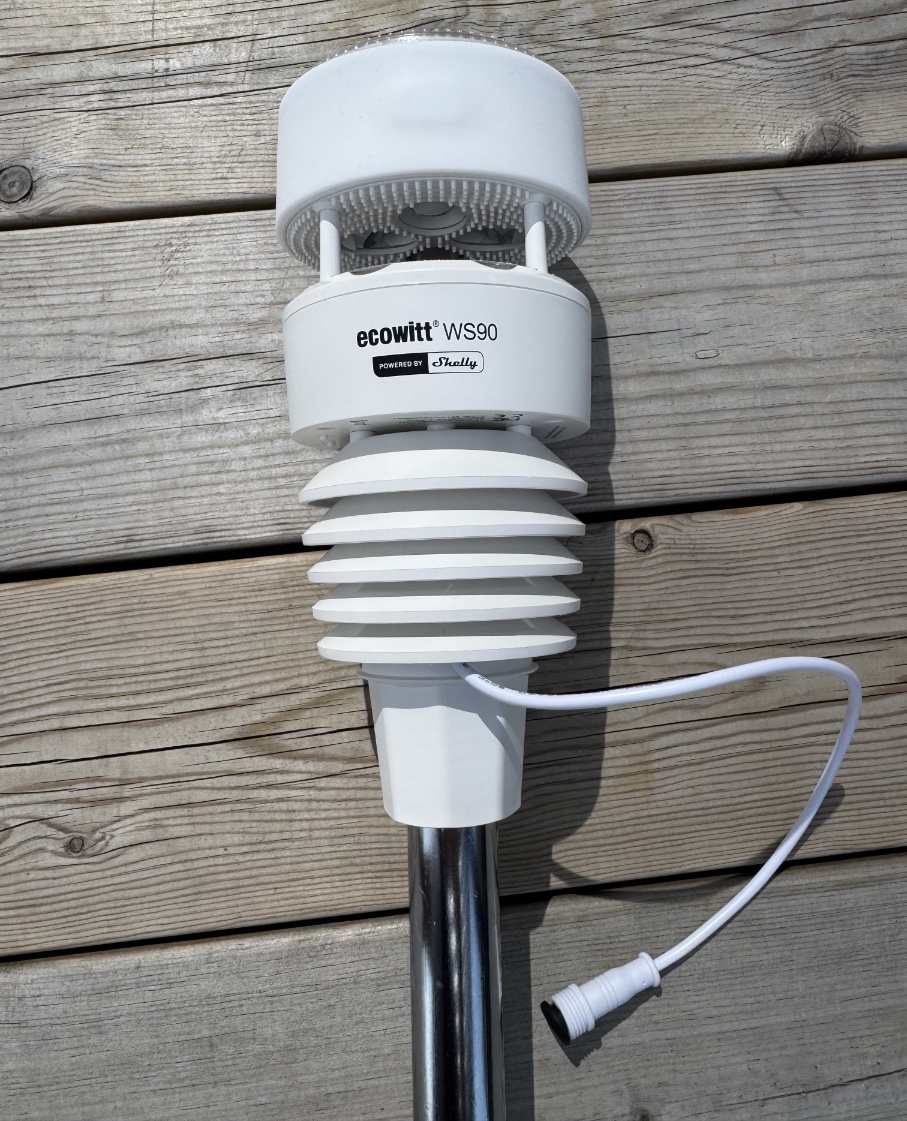
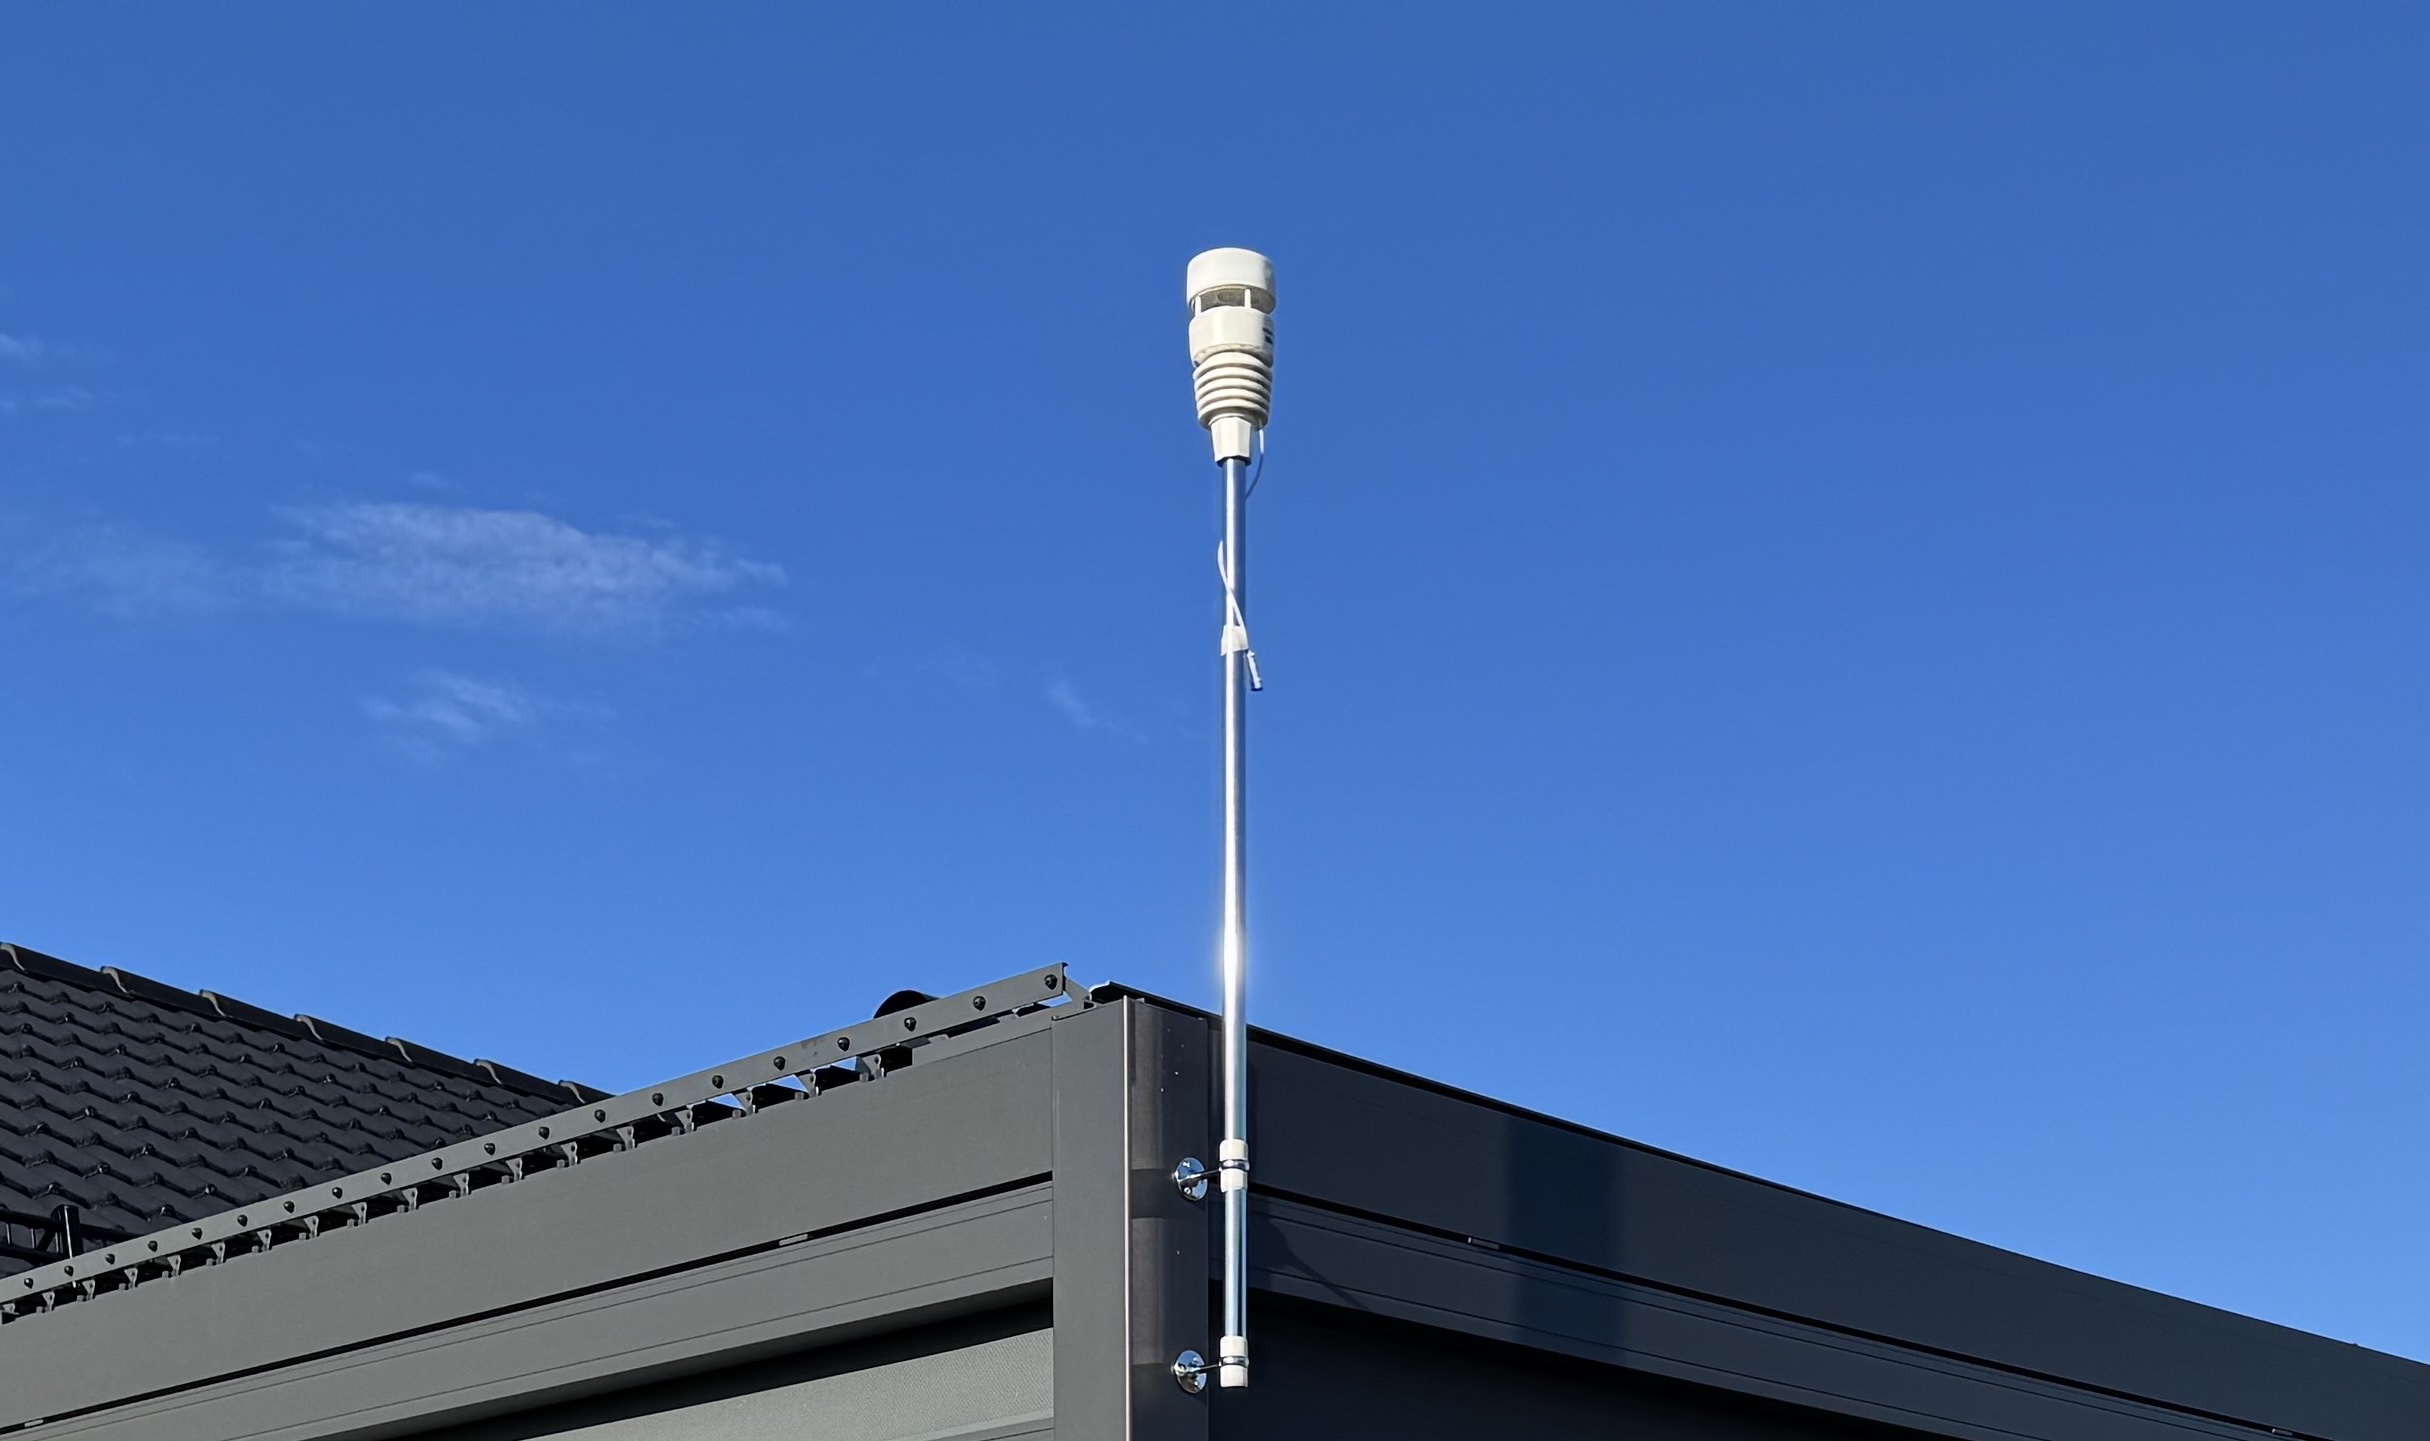
As for where to mount that pole with the station on it, people on weather forums unanimously say that good positioning of the station is more important than the quality/accuracy of its sensors, so you should really take your time and think about possible locations. One of the best places would be the house roof, somewhere on the edge, and I would very much like to install it there, but I don’t have a big enough ladder, and my roof has nothing to mount the pole on, so I settled with attaching it to a shed:
That involved drilling in metal, which I’ve never done before, so no surprise that I broke one drill bit and screwed up the surface a bit:
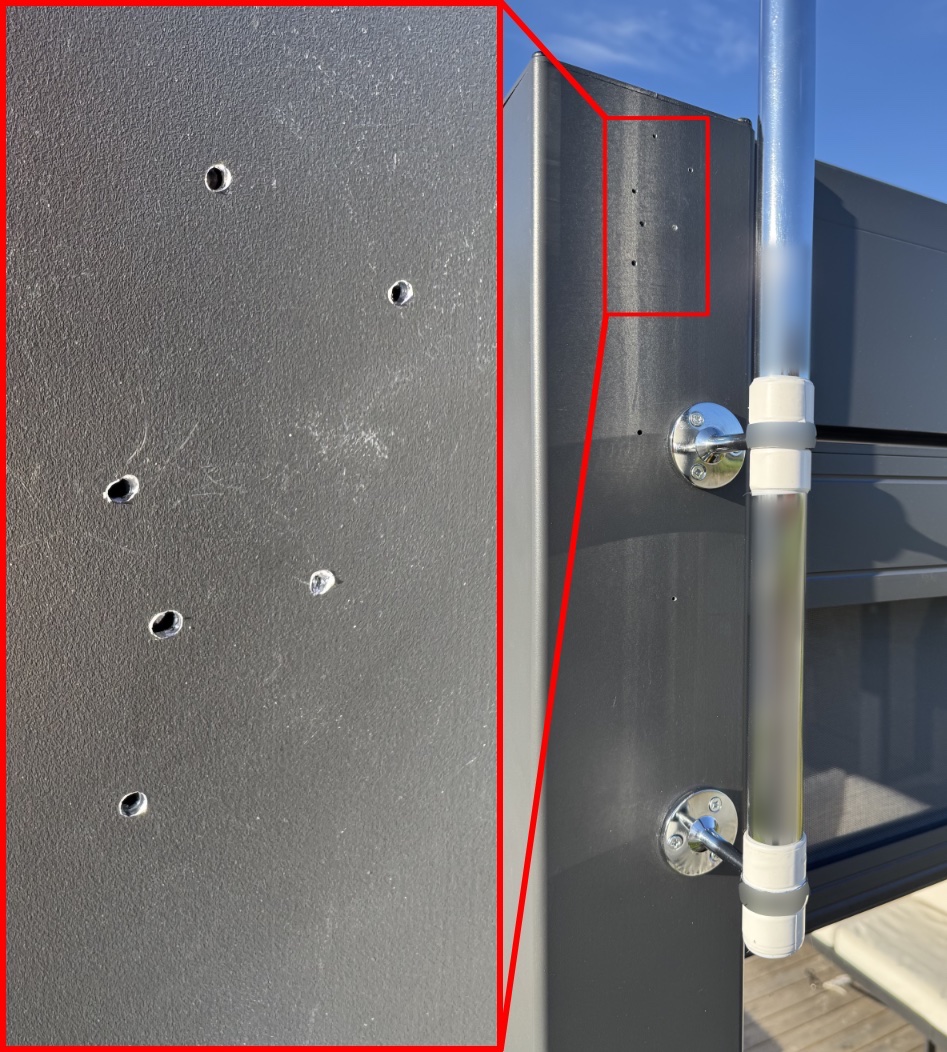
That’s some real mad skills right there, eh.
Don’t forget to align the N marker arrow on the station body so it would point to the north, otherwise your wind direction measurements will be all wrong.
Home Assistant
Connecting via Zigbee2MQTT
Nothing special here, the device is supported out of the box, so you just permit joining for new devices in Zigbee2MQTT and then put the station into pairing mode (by pressing the CAL button twice).
For me the interviewing process was going somewhat flaky at first: the device was appearing and disappearing in the list, not being able to finish pairing. It paired successfully only on the second (or third?) try, which is why you shouldn’t rush with mounting the station before it is properly connected, as every pairing attempt requires pressing that CAL button on the station.
Also, although probably unrelated, my Zigbee2MQTT container crashed shortly after I paired the station. I couldn’t find the reason in the logs, so it might have been just a coincidence, but it never crashed before, so that was mighty suspicious. After a restart it did not crash again and has been working fine ever since.
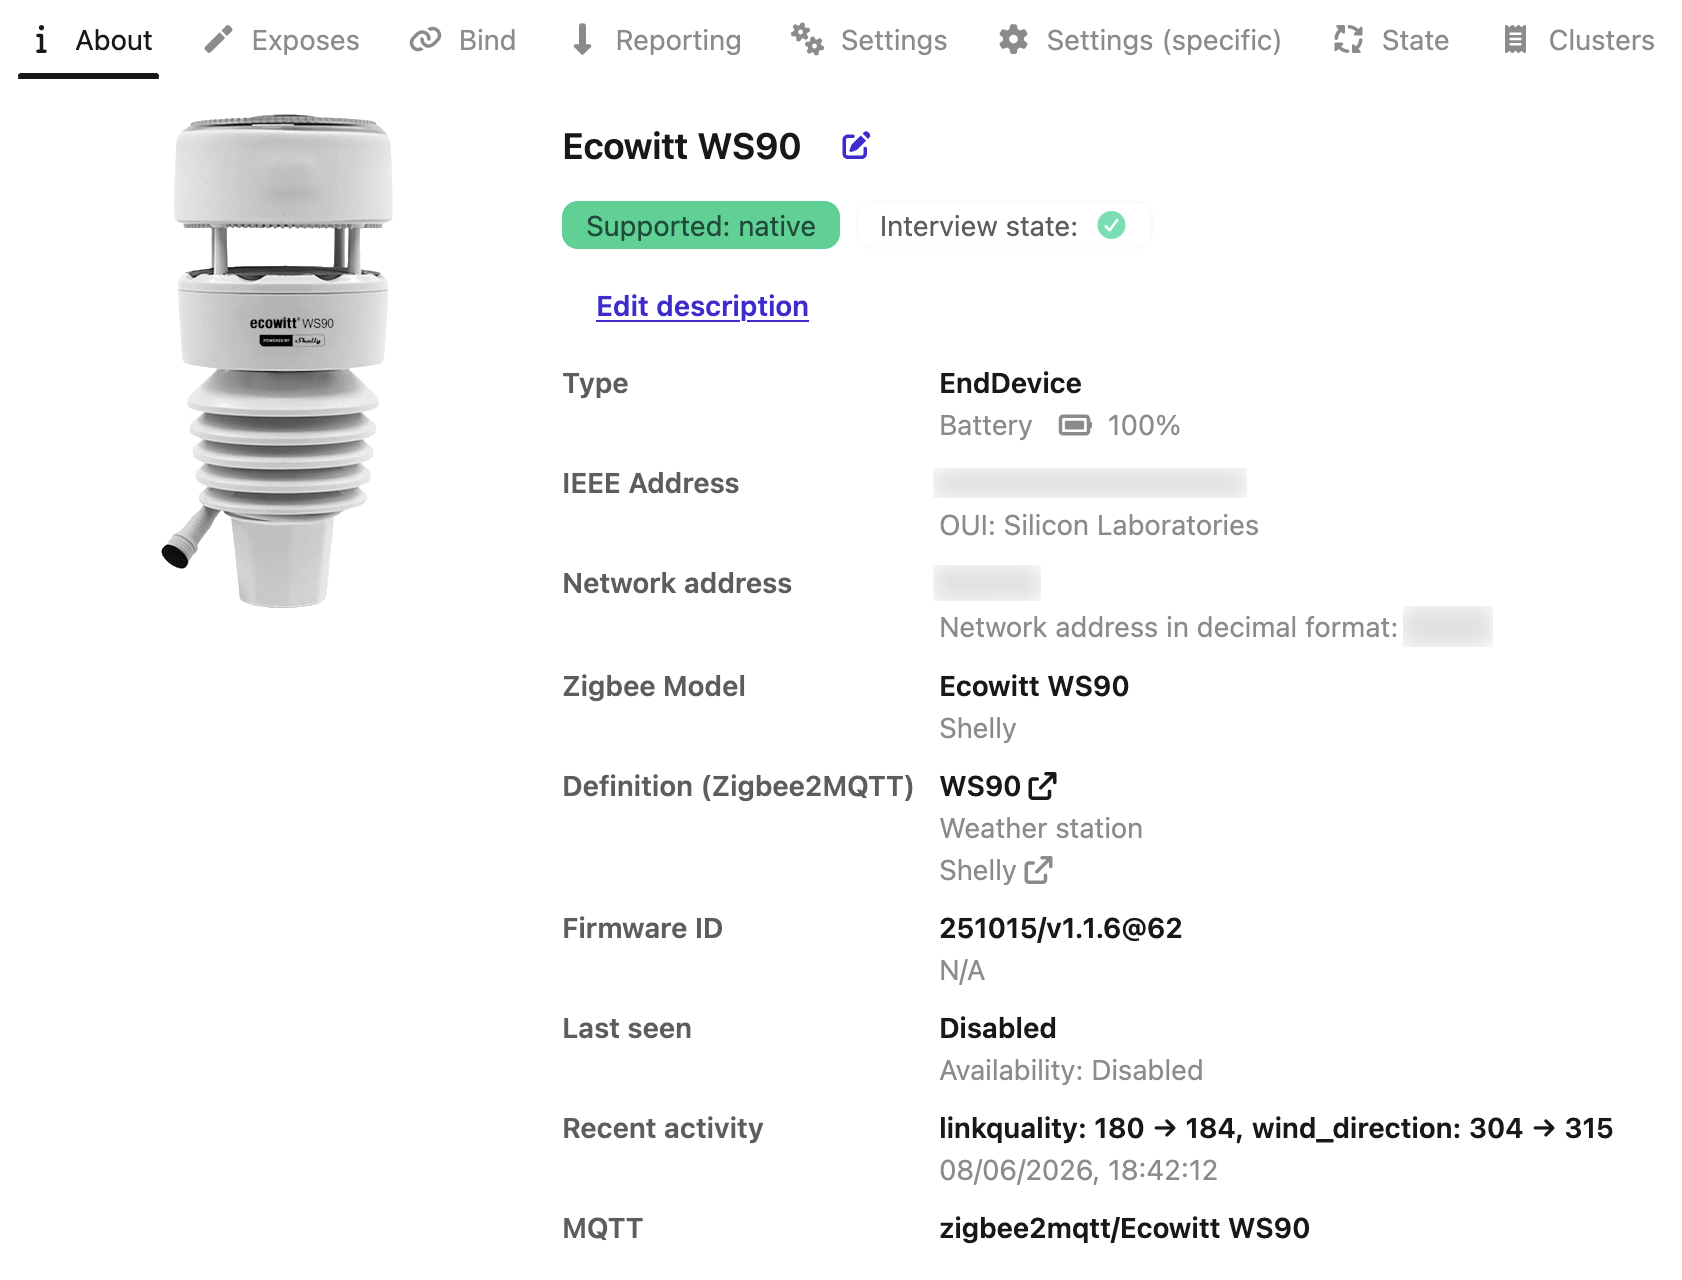
Once discovered and interviewed, here’s how the device will look like in Zigbee2MQTT frontend:
Sensors data
Aside from the basic sensors you will also get several derived/calculated sensors, and even more of those you will create yourself as template/statistics/utility helpers to convert between different units, collect various statistics and such. So in total it is quite a lot of data, some of which you might want to exclude from recorder.
Wind speed
Not sure why, but by default I got wind speed (wind_speed) in km/h, even though both documentation and my Zigbee2MQTT device page state that it should be in m/s. It is probably Home Assistant who converts that behind the scenes, likely based on some locale settings, but I didn’t find where to change that.
At the same time, the wind gust speed (gust_speed) is reported in m/s, and I have no idea why this one isn’t in km/h too.
But anyway, since I wanted to have both of them in m/s, I had to create only one template sensor for converting from km/h to m/s. The conversion formula is no secret:
and so as a template expression it will be this:
{{ (states('sensor.ecowitt_ws90_wind_speed') | float / 3.6) | round(1) }}
Then to create such a sensor you need to open Settings → Devices & services → Helpers → Create helper → Template → Sensor:
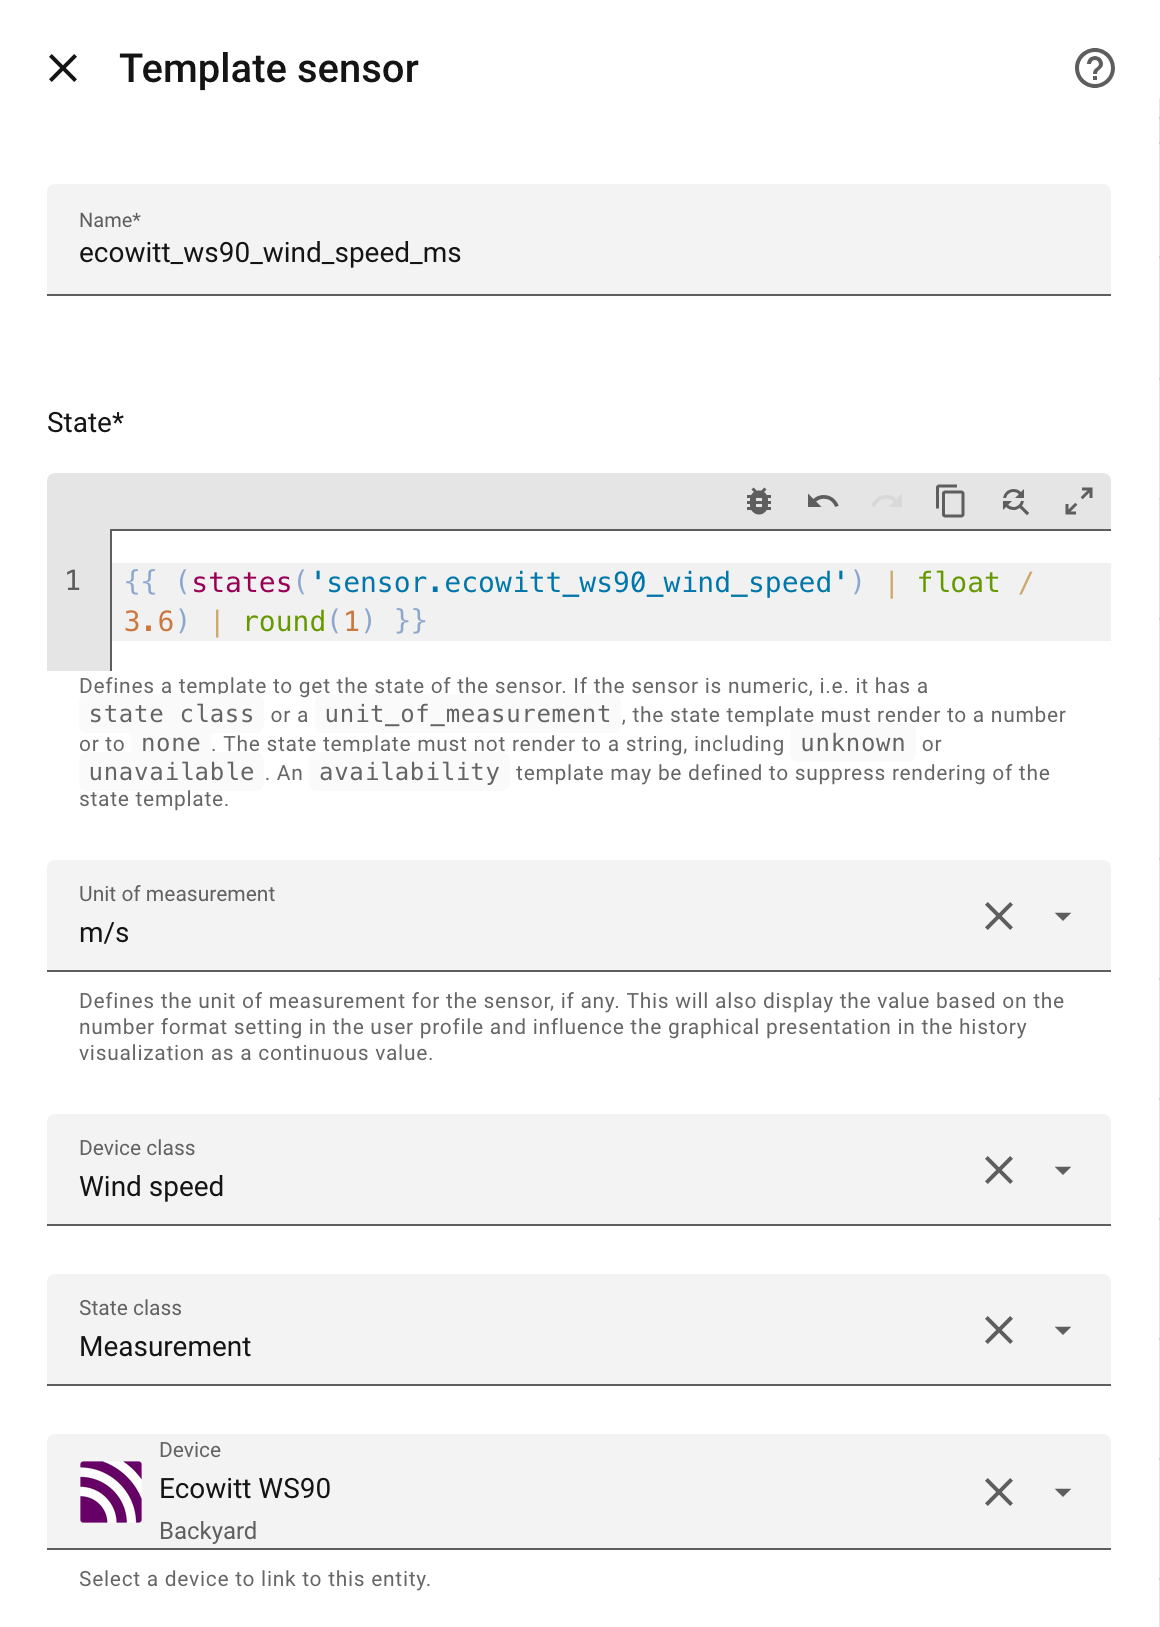
If you add ecowitt_ws90_ prefix to the sensor name and assign it to ecowitt_ws90 device, then it will add that prefix one more time, making the resulting sensor name ecowitt_ws90_ecowitt_ws90_wind_speed, so you’ll need to delete the duplicate prefix right after creating the sensor.
One more thing to watch out for is that it can also mess up the unit of measurement, making it km/h all of a sudden, so you better check and fix that too.
Wind direction
The wind direction is reported in degrees, which is not very convenient, but it is easy enough to convert that into letters:
{% set directions = [ 'N', 'NNE', 'NE', 'ENE', 'E', 'ESE', 'SE', 'SSE', 'S', 'SSW', 'SW', 'WSW', 'W', 'WNW', 'NW', 'NNW', 'N'] -%}
{% set bearing = directions[ ((states('sensor.ecowitt_ws90_wind_direction') | int(0) / 22.5) | round(0) | int) ] %}
{{ bearing }}
Moreover, using this fantastic windrose card, you can make a super nice chart such as this:
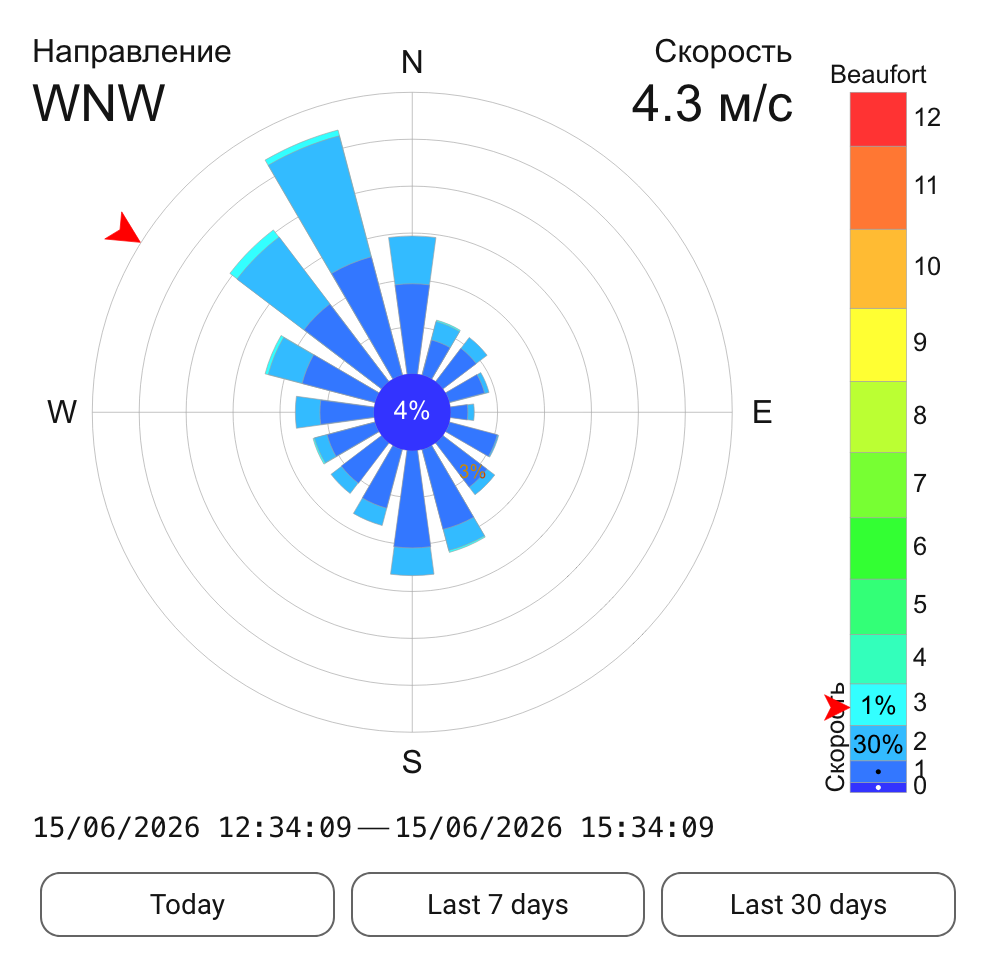
Here it is in YAML:
type: custom:windrose-card
data_period:
  period_back: "-3h"
rose_config:
  windrose_draw_north_offset: 0
  center_calm_percentage: true
refresh_interval: 300
windspeed_bar_location: right
wind_direction_entity:
  entity: sensor.ecowitt_ws90_wind_direction
  use_statistics: false
  direction_compensation: 0
windspeed_entities:
  - entity: sensor.ecowitt_ws90_wind_speed_ms
    name: Скорость
    speed_unit: mps
    use_statistics: false
    windspeed_bar_full: true
    output_speed_unit: mps
    speed_range_beaufort: true
    current_speed_arrow: true
buttons_config:
  location: bottom
  buttons:
    - type: period_selector
      button_text: Today
      preset_period: today
    - type: period_selector
      button_text: Last 7 days
      preset_period: last_7_days
    - type: period_selector
      button_text: Last 30 days
      preset_period: last_30_days
      use_analytics: true
      analytics_period: hour
direction_labels:
  cardinal_direction_letters: NESW
current_direction:
  show_arrow: true
matching_strategy:
  name: direction-first
corner_info:
  top_left:
    label: Направление
    unit: ""
    entity: sensor.ecowitt_ws90_wind_direction_compass
  top_right:
    label: Скорость
    unit: " м/с"
    entity: sensor.ecowitt_ws90_wind_speed_ms
text_blocks:
  bottom:
    text: >-
      <code>${start-date} ${start-time}</code> ⎯ <code>${end-date}
      ${end-time}</code>
Precipitation
There is ecowitt_ws90_precipitation sensor, whose value is constantly increasing (when there is rain), which is a rather useless data on its own. To make it more useful you can create a utility meter for measuring daily (hourly, etc) precipitation:
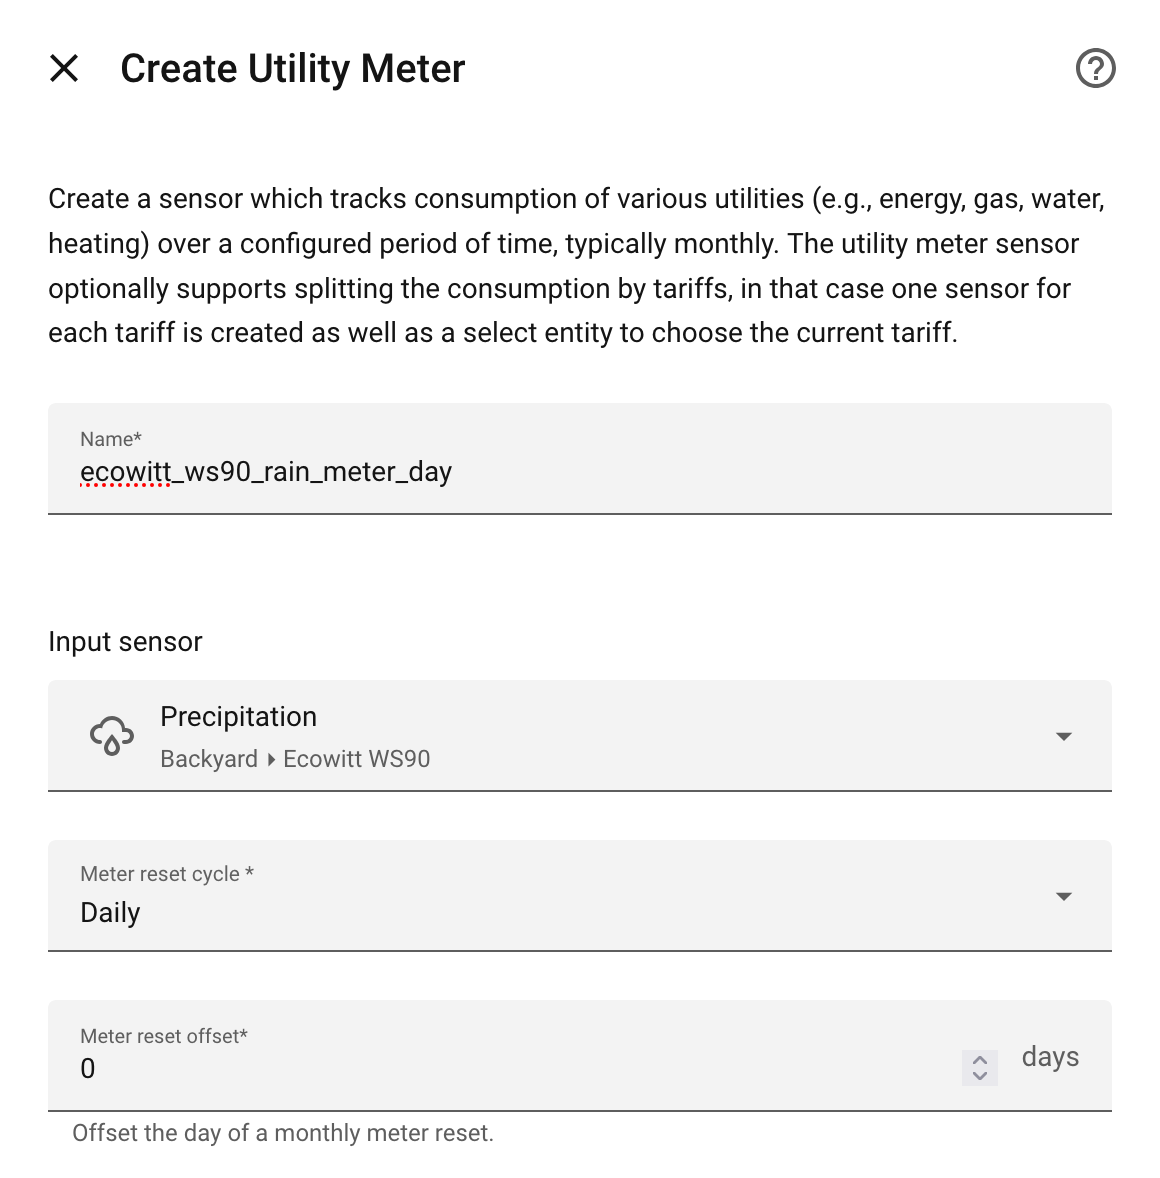
And then you’ll have actually meaningful data and charts showing how much rain there was on a particular day:
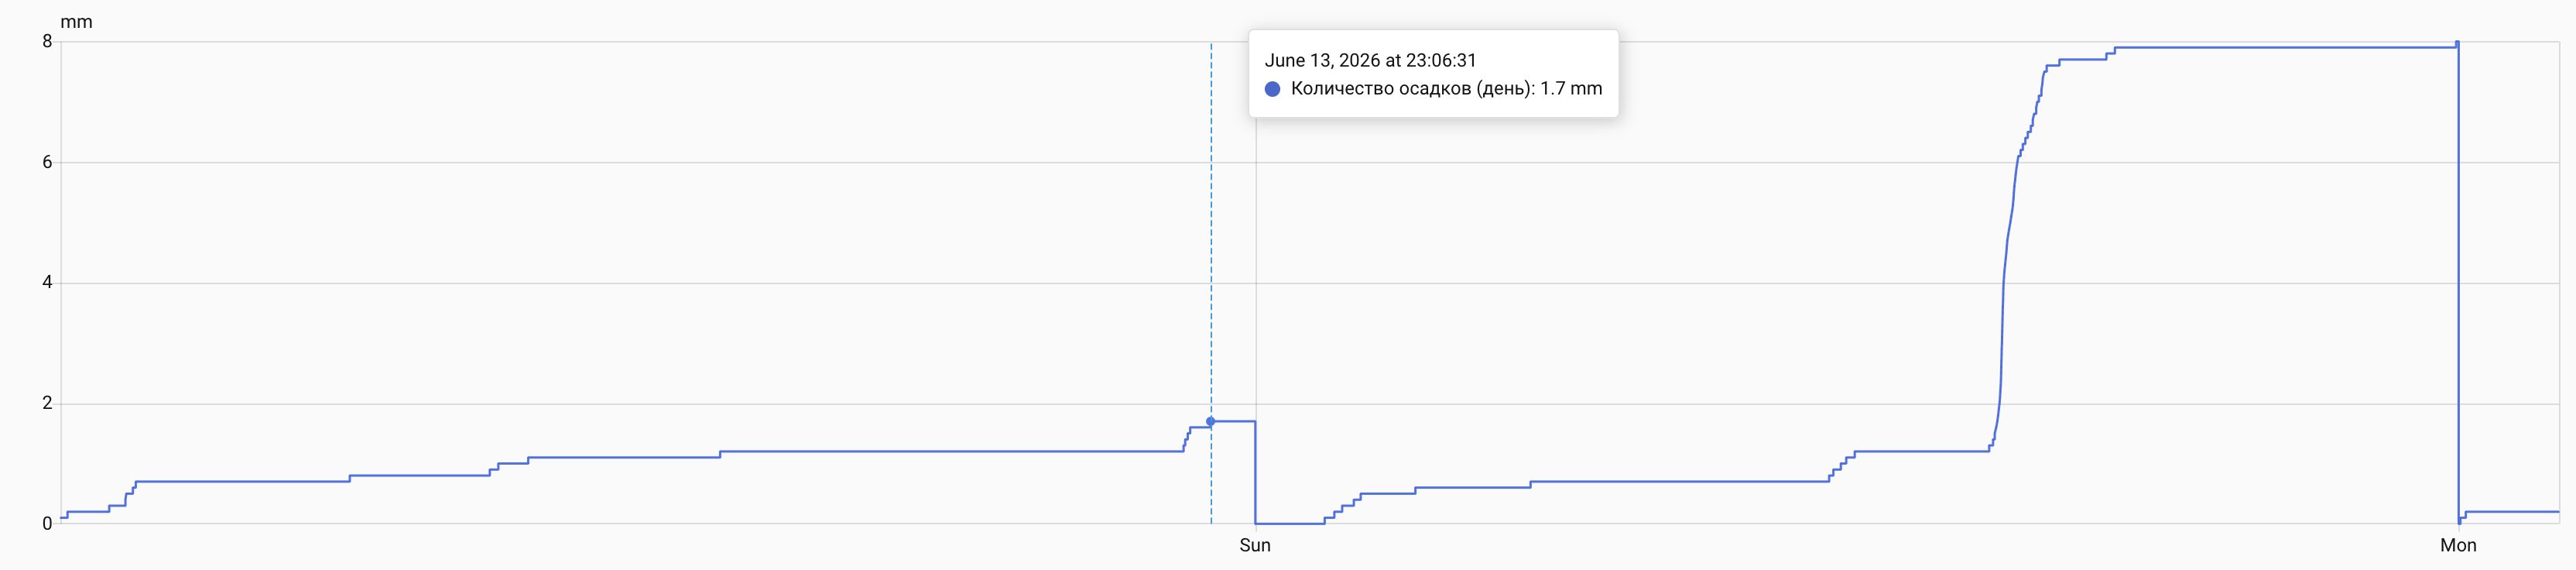
But there is a problem with that main ecowitt_ws90_precipitation sensor, because sometimes its value drops to 0 for a short (single reading?) period of time:
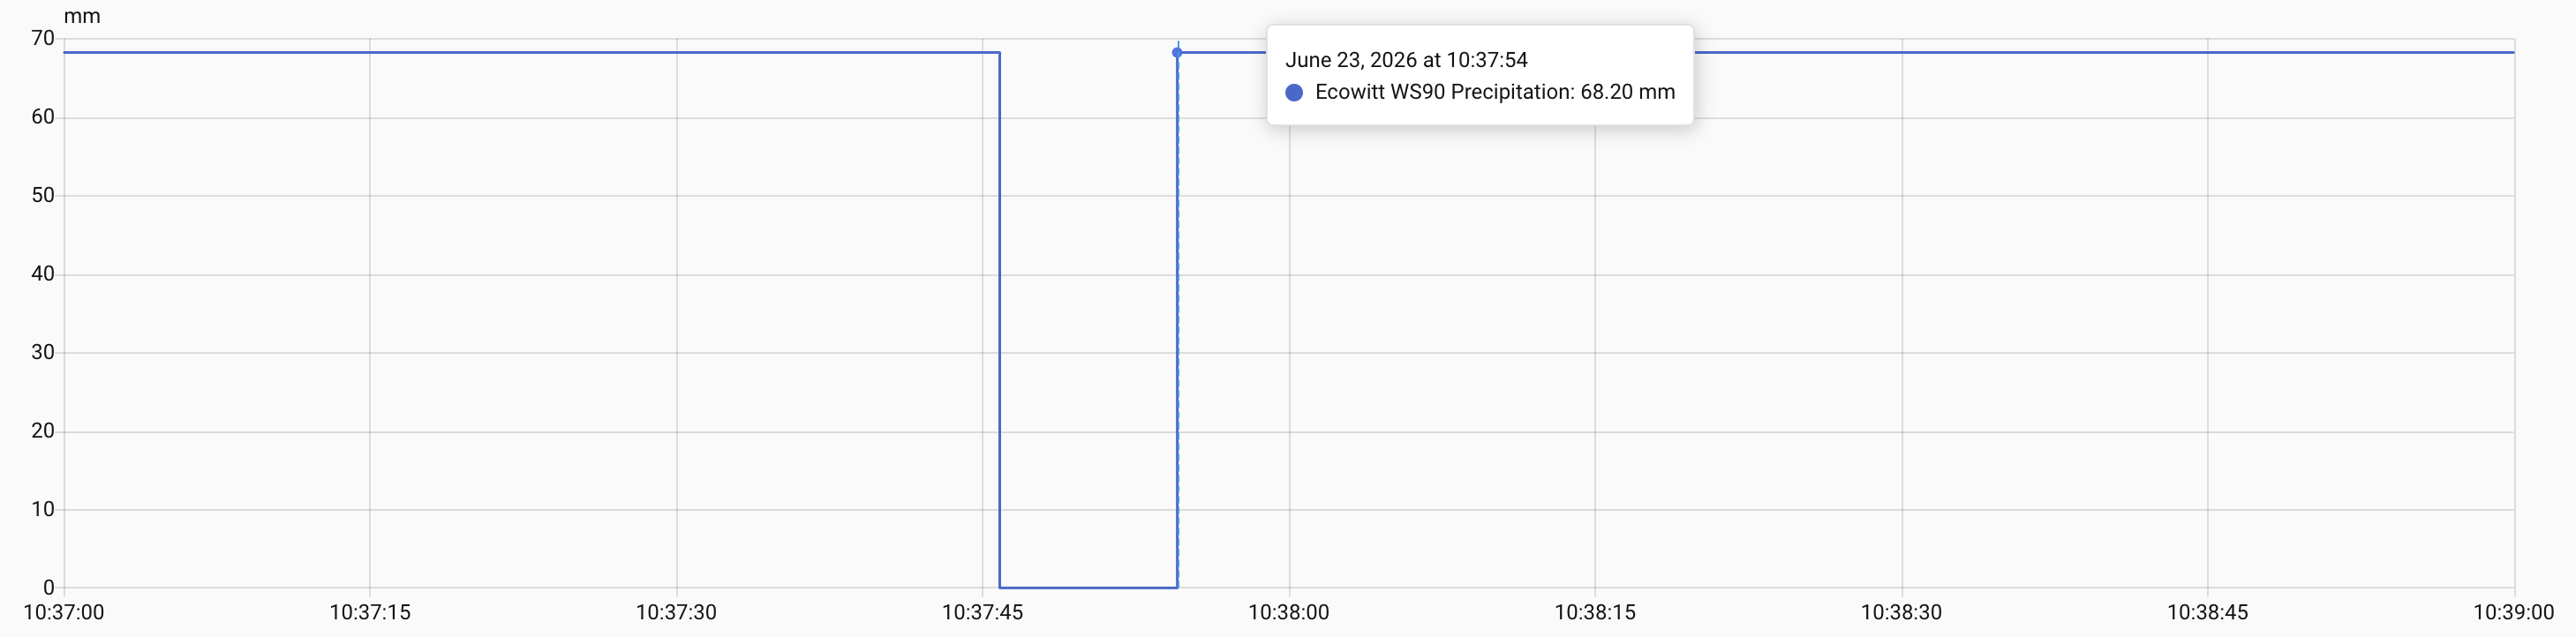
Zigbee2MQTT logs contain the following records during that time:
info: zh:ember:ezsp: Received network/route error ROUTE_ERROR_INDIRECT_TRANSACTION_EXPIRY for "59364".
info: zh:ember:ezsp: Received network/route error ROUTE_ERROR_INDIRECT_TRANSACTION_EXPIRY for "59364".
error: z2m: Exception while calling fromZigbee converter: Value is not a number, got number (NaN)}
Don’t know why this happens. Probably the data payload gets lost/dropped/corrupted, but the reading event still fires (as it is the station who pushes data to Zigbee coordinator, isn’t it?) with some invalid/null values, which Home Assistant then treats as 0? Either way, this fucks up the dataset and so all the derived sensors (such as daily/hourly precipitation) too. Fortunately, it can be mitigated by… creating one more template sensor, of course:
sensor:
  - name: "Precipitation (stable)"
    unit_of_measurement: "mm"
    device_class: precipitation
    state_class: total_increasing
    state: >
      {#
          The float(-1) on the raw value parses `unknown`/`unavailable` as `-1`,
          which is less than `prev`, so those won't drop the sensor readings to `0`
      #}
      {% set raw = states('sensor.ecowitt_ws90_precipitation') | float(-1) %}
      {% set prev = states('sensor.ecowitt_ws90_precipitation_stable') | float(0) %}
      {% if raw < prev %}
        {{ prev }}
      {% else %}
        {{ raw }}
      {% endif %}
    availability: >
      {{ states('sensor.ecowitt_ws90_precipitation') not in ['unknown', 'unavailable'] }}
and then you base the rain utility meters on this one instead of the main ecowitt_ws90_precipitation.
As a matter of fact, it is not just precipitation - all the other sensors (temperature, pressure, illuminance, etc) drop to 0 together, so it is the entire device sending zeroes for everything. That means you’ll have to crutch around these dropouts for every single sensor that you want to have stable datasets for. Alternatively, it probably can be done in Zigbee2MQTT (via custom external converter?), so the “bad” values would never even reach Home Assistant, but I haven’t tried that approach.
To see what is actually being sent from the device during the dropouts, I enabled debug log level in Zigbee2MQTT’s configuration.yaml (don’t forget to revert this change afterwards):
# ...
advanced:
  log_level: warning
  log_namespaced_levels:
    z2m: debug
    z2m:mqtt: warning
  log_output:
    - console
    - file
and here’s what I captured in the logs on the next dropout:
--
11823:[2026-08-22 09:57:23] debug:     z2m: Received Zigbee message from 'Ecowitt WS90', type 'attributeReport', cluster 'shellyWS90Wind', data '{"windSpeed":9}' from endpoint 1 with groupID 0
11824:[2026-08-22 09:57:23] debug:     z2m: Received Zigbee message from 'Ecowitt WS90', type 'attributeReport', cluster 'shellyWS90Wind', data '{"windDirection":3150}' from endpoint 1 with groupID 0
--
11860:[2026-08-22 09:57:44] debug:     z2m: Device 'Ecowitt WS90' announced itself
11864:[2026-08-22 09:57:46] debug:     z2m: Retrieving state of 'Ecowitt WS90' after reconnect
--
11873:[2026-08-22 09:57:51] debug:     z2m: Received Zigbee message from 'Ecowitt WS90', type 'attributeReport', cluster 'msIlluminanceMeasurement', data '{"measuredValue":0}' from endpoint 1 with groupID 0
11874:[2026-08-22 09:57:52] debug:     z2m: Received Zigbee message from 'Ecowitt WS90', type 'attributeReport', cluster 'msTemperatureMeasurement', data '{"measuredValue":0}' from endpoint 1 with groupID 0
11875:[2026-08-22 09:57:52] debug:     z2m: Received Zigbee message from 'Ecowitt WS90', type 'attributeReport', cluster 'shellyWS90UV', data '{"uvIndex":0}' from endpoint 1 with groupID 0
11876:[2026-08-22 09:57:52] debug:     z2m: Received Zigbee message from 'Ecowitt WS90', type 'attributeReport', cluster 'msPressureMeasurement', data '{"measuredValue":0}' from endpoint 1 with groupID 0
11878:[2026-08-22 09:57:52] debug:     z2m: Received Zigbee message from 'Ecowitt WS90', type 'attributeReport', cluster 'msRelativeHumidity', data '{"measuredValue":0}' from endpoint 1 with groupID 0
11879:[2026-08-22 09:57:52] debug:     z2m: Received Zigbee message from 'Ecowitt WS90', type 'attributeReport', cluster 'shellyWS90Rain', data '{"precipitation":0,"rainStatus":0}' from endpoint 1 with groupID 0
11880:[2026-08-22 09:57:52] debug:     z2m: Received Zigbee message from 'Ecowitt WS90', type 'attributeReport', cluster 'shellyWS90Wind', data '{"gustSpeed":null,"windDirection":0,"windSpeed":0}' from endpoint 1 with groupID 0
11883:[2026-08-22 09:57:52] debug:     z2m: Received Zigbee message from 'Ecowitt WS90', type 'attributeReport', cluster 'msIlluminanceMeasurement', data '{"measuredValue":0}' from endpoint 1 with groupID 0
11884:[2026-08-22 09:57:53] debug:     z2m: Received Zigbee message from 'Ecowitt WS90', type 'attributeReport', cluster 'msPressureMeasurement', data '{"measuredValue":0}' from endpoint 1 with groupID 0
11887:[2026-08-22 09:57:53] debug:     z2m: Received Zigbee message from 'Ecowitt WS90', type 'attributeReport', cluster 'msRelativeHumidity', data '{"measuredValue":0}' from endpoint 1 with groupID 0
--
11897:[2026-08-22 09:57:59] debug:     z2m: Received Zigbee message from 'Ecowitt WS90', type 'attributeReport', cluster 'msIlluminanceMeasurement', data '{"measuredValue":43182}' from endpoint 1 with groupID 0
11899:[2026-08-22 09:57:59] debug:     z2m: Received Zigbee message from 'Ecowitt WS90', type 'attributeReport', cluster 'msTemperatureMeasurement', data '{"measuredValue":1350}' from endpoint 1 with groupID 0
11900:[2026-08-22 09:57:59] debug:     z2m: Received Zigbee message from 'Ecowitt WS90', type 'attributeReport', cluster 'msPressureMeasurement', data '{"measuredValue":994}' from endpoint 1 with groupID 0
11901:[2026-08-22 09:57:59] debug:     z2m: Received Zigbee message from 'Ecowitt WS90', type 'attributeReport', cluster 'msRelativeHumidity', data '{"measuredValue":8200}' from endpoint 1 with groupID 0
11902:[2026-08-22 09:57:59] debug:     z2m: Received Zigbee message from 'Ecowitt WS90', type 'attributeReport', cluster 'shellyWS90Wind', data '{"gustSpeed":16,"windDirection":2990,"windSpeed":16}' from endpoint 1 with groupID 0
11903:[2026-08-22 09:57:59] debug:     z2m: Received Zigbee message from 'Ecowitt WS90', type 'attributeReport', cluster 'shellyWS90UV', data '{"uvIndex":10}' from endpoint 1 with groupID 0
11906:[2026-08-22 09:57:59] debug:     z2m: Received Zigbee message from 'Ecowitt WS90', type 'attributeReport', cluster 'shellyWS90Rain', data '{"precipitation":1497,"rainStatus":1}' from endpoint 1 with groupID 0
--
As you can see, what (apparently) happens is Ecowitt WS90 randomly restarts at an arbitrary point of time, and the very first data frame that it sends after starting-up (from 09:57:51 to 09:57:53) contains zeroes for all the sensors. And then the second data frame (at 09:57:59) contains the actual readings, and it works fine onwards.
Very fucking unfortunate indeed, especially that why the fuck does it restart in the first place. I hope these sporadic restarts/resets will eventually get fixed with a firmware update.
Atmospheric pressure
So yes, ecowitt_ws90_pressure sensor also drops out to 0 from time to time. And to work around that you will need to create… no, not a template sensor this time, but a fiter. At first I went with the outlier filter:
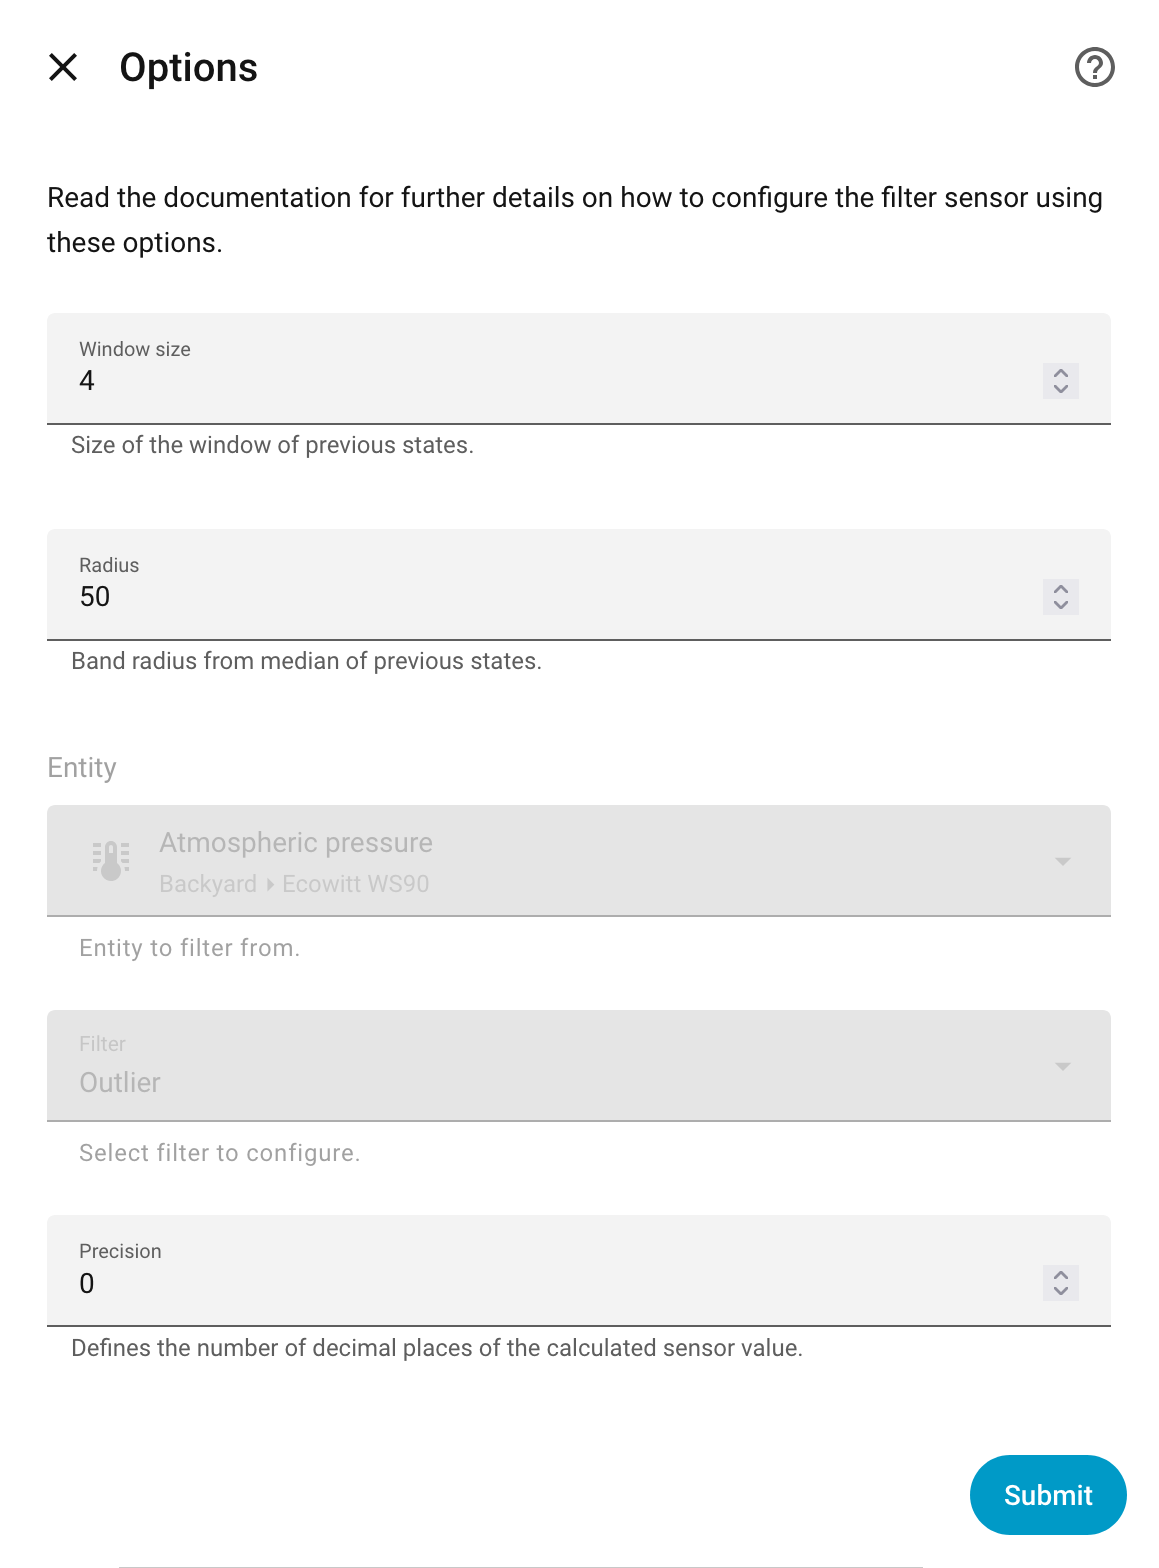
It seemed to have worked, but I got “stuck” values, or at least the historical charts were stale (even though the current/live values were reporting correctly):
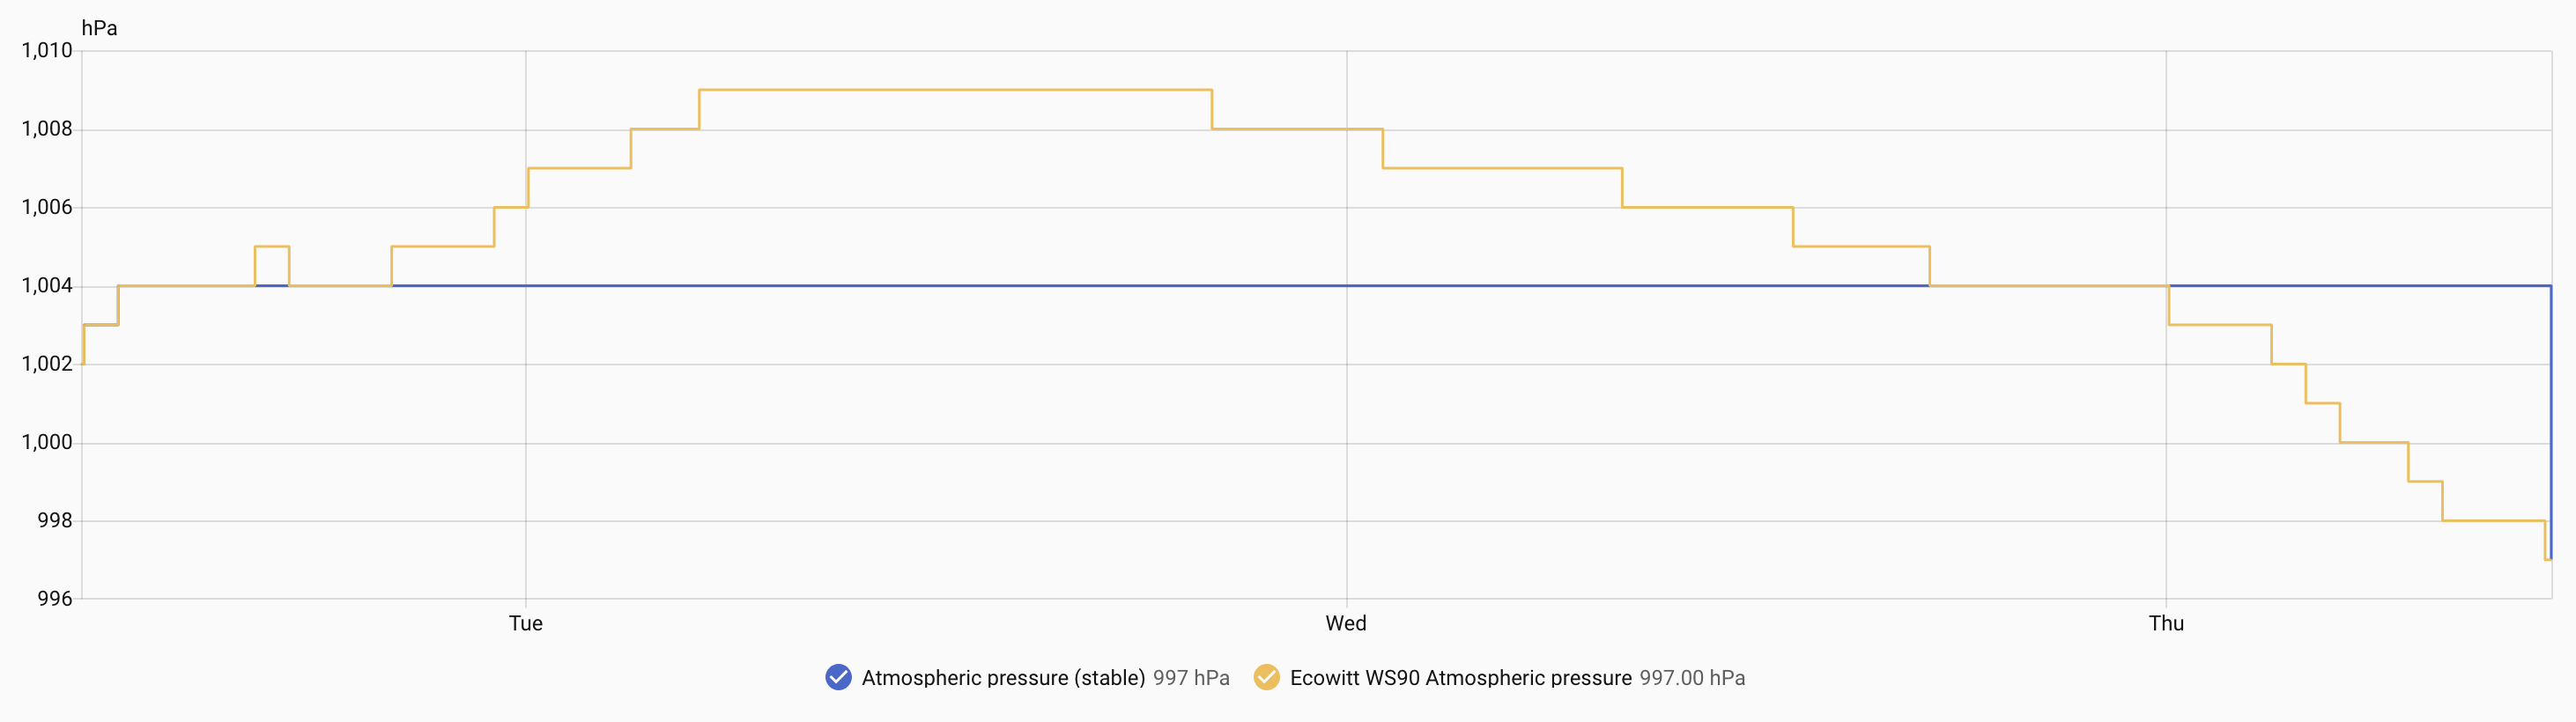
I thought that maybe it was because the radius and window values were not very good, but instead of adjusting those I decided to try a different filter - the range one - as it seemed to fit better for the particular purpose of excluding 0 values from the atmospheric pressure measurements:
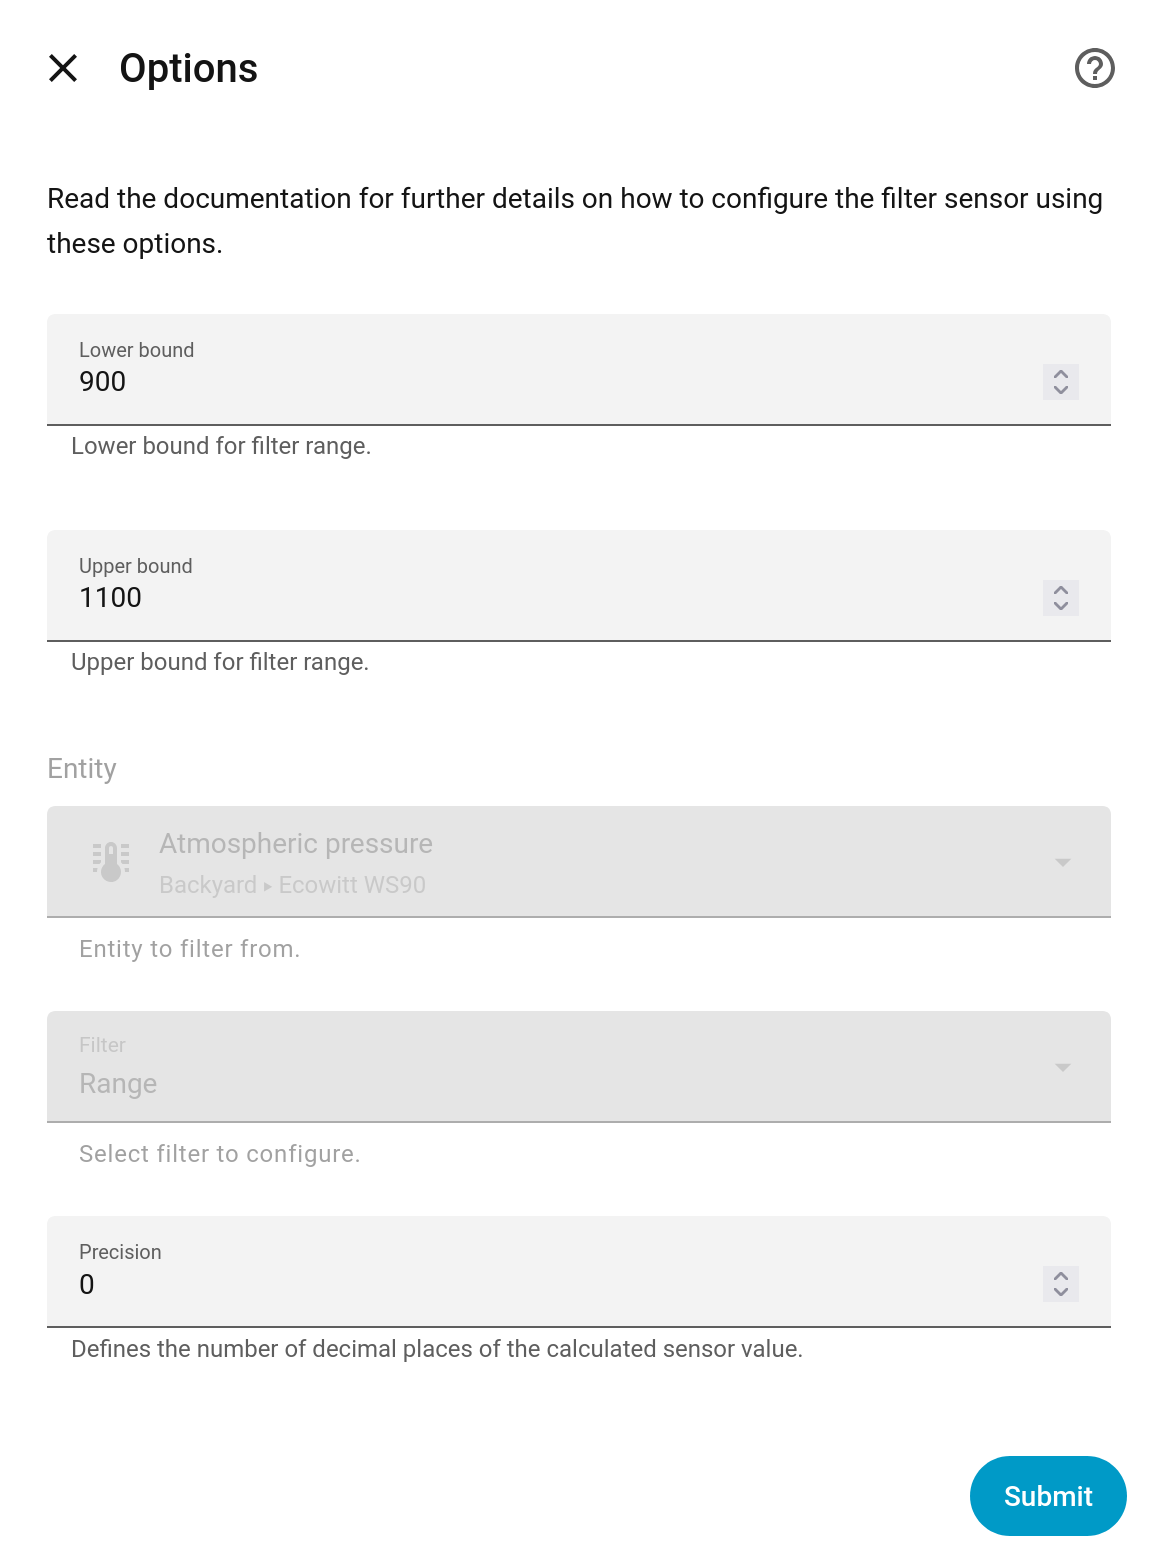
However, what I noticed next was that during those spurious dropouts to 0 my new range-filtered atmospheric pressure was getting 900 value - the lower bound of the filter - and that is explicitly stated in the documentation (if only I read it carefully). And while 900 is much better than 0, it is still a wrong value, so then an even better way to go about excluding dropouts would be a combination of an adjusted outlier filter and this range filter, like so:
- sensor:
  - platform: filter
    name: "ecowitt_ws90_pressure_stable"
    unique_id: ecowitt_ws90_pressure_stable
    entity_id: sensor.ecowitt_ws90_pressure
    filters:
      - filter: outlier
        window_size: 10
        radius: 20
      - filter: range
        lower_bound: 900
        upper_bound: 1100
But actually, as I realized a bit later, the reason for the stale/stuck history chart in the first place was me, myself and I, who disabled this new ecowitt_ws90_pressure_stable sensor in recorder, so it was only right that the current/live readings were correct but there was no long-term statistics for the charts. After I removed it from the blacklist (the exclude configuration variable), the historical data got collected and the charts got “unstuck”. So then I just reverted to the outlier filter alone, as there was nothing wrong with it (aside from maybe a bit worse radius and window values).
Sadly, applying a filter does not eliminate the dropouts problem completely, as I still get those about once a week. Given the origin of the problem (arbitrary device resets/restarts), the only(?) proper solution would be Shelly delivering a fix for this bug via a firmware update.
Anyway, getting back to it, the measurement unit for this new ecowitt_ws90_pressure_stable sensor is hPa, because I got the original ecowitt_ws90_pressure in hPa (although apparently it should have been kPa).
If you’ll want it to be in mmHg, then that is a yet another template sensor. The formula is:
and as a template:
{{ (states('sensor.ecowitt_ws90_pressure_stable') | float * 0.7500615) | round(1) }}
Note that here (as well as in wind speed conversion or anywhere else) the round filter must apply to the entire expression in parenthesis. At first I made a mistake of simply “piping” it to the end of the expression, and that produced incorrect results:
{#
    993 - original value in hPa
#}
{{ states('sensor.ecowitt_ws90_pressure_stable') }}

{#
    794.4000000000001 - incorrect result, because here round(1) applies
    only to 0.7500615 and makes it 0.8
#}
{{ states('sensor.ecowitt_ws90_pressure_stable') | float * 0.7500615 | round(1) }}

{#
    794.4000000000001 - same incorrect result,
    just to illustrate the previous comment
#}
{{ states('sensor.ecowitt_ws90_pressure_stable') | float * 0.8 }}

{#
    744.8 - correct result, because here round(1) applies
    to the entire expression
#}
{{ (states('sensor.ecowitt_ws90_pressure_stable') | float * 0.7500615) | round(1) }}
Absolute or relative
When I was comparing my station data with (spoilers) other weather stations in the area, I noticed that almost all of them report higher atmospheric pressure values than mine, such as if mine is 1002 hPa, then theirs would be 1014 hPa in average. And this was consistent across different weather services, so it was not just one single service being weird.
The only explanation I could come up with was me not accounting for sea level, meaning that those stations do account for it and report relative pressure, while mine just reports absolute pressure as is.
To adjust absolute pressure to relative, the formula is:
$$P_{rel} = P_{abs} \times \left(1 - \frac{0.0065 \times h}{(T + 0.0065 \times h + 273.15)}\right)^{-5.257}$$where:
h- weather station elevation above sea level in meters;T- current temperature in Celsius;-5.257- you don’t want to know.
If I take the current temperature of 23.3°C, my elevation of 113 meters and current absolute atmospheric pressure of 1002 hPa, then by this formula my current relative atmospheric pressure is 1015 hPa - right in the range of what other stations are reporting around me.
There is also a much simpler formula without the temperature, lapse rate or any other black magic constants, as their effect is rather negligible for elevations under 1000 meters:
$$P_{rel} = P_{abs} + h \times 0.12$$but we are not looking for easy ways, are we.
A template expression for the conversion would be:
{{
  (
    states('sensor.ecowitt_ws90_pressure_stable') | int
    *
    (
      1
      -
      (
        (0.0065 * 113)
        /
        (states('sensor.ecowitt_ws90_temperature') | float + 0.0065 * 113 + 273.15)
      )
    ) ** -5.257
  ) | round(0)
}}
Okay, but which value am I supposed to publish to weather services: the absolute one or the relative one? Who the fuck knows, not a single motherfucking service has an explicit clarification for that in their API documentation. At the same time, all of them require specifying the weather station elevation when you register it, but for what fucking purpose then, if they don’t use it to convert the absolute pressure values into relative ones?
The only indication (aside from my misalignment with the neighbouring stations) that I found was… a switch in the unit settings on PWSWeather station page. Here’s what it shows with ALTIM. option selected:
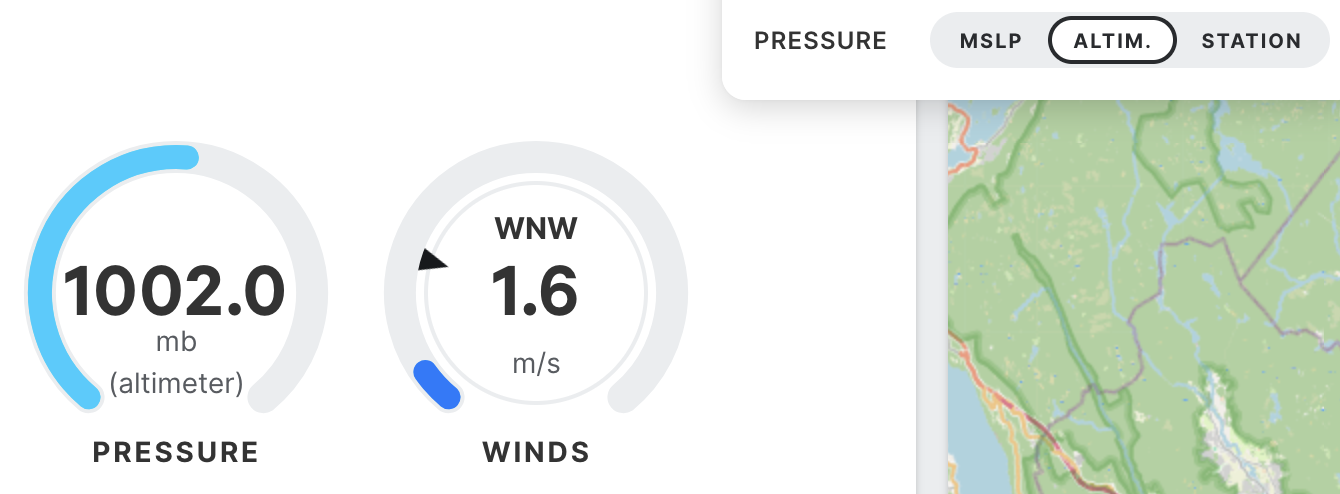
which is the 1002 hPa value reported by my station. And here’s what it shows if I select STATION:
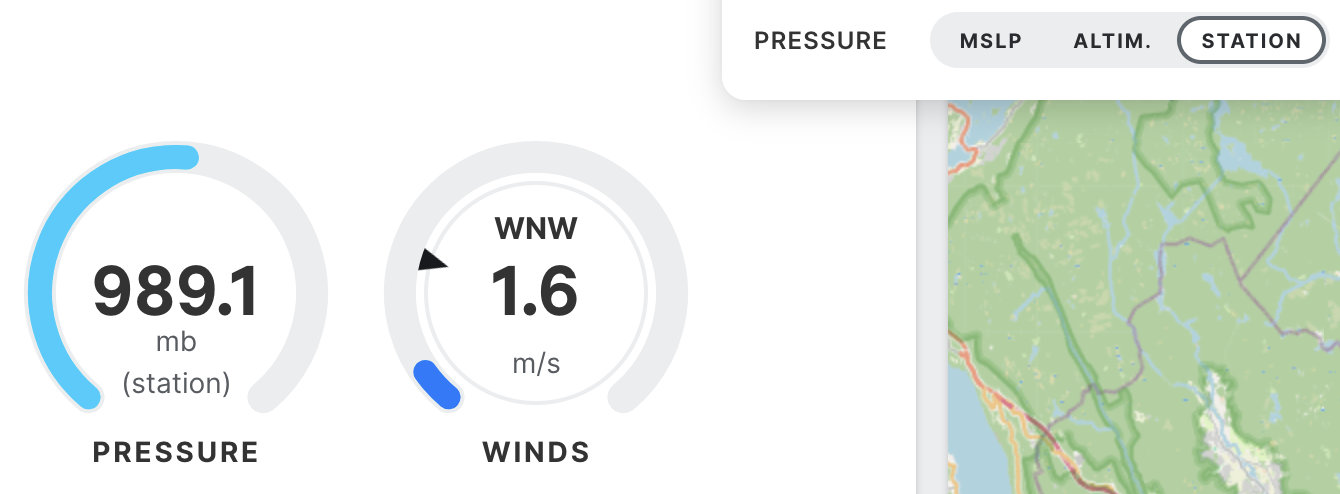
So okay then, that settles it - I need to publish the relative value (1015 hPa from the example calculation above), which is what will go into the ALTIM., and then I reckon the STATION will show something around 1002 hPa.
If you already created a template for the hPa/mmHg conversion, then don’t forget to update it to use this new ecowitt_ws90_pressure_stable_relative instead if the absolute ecowitt_ws90_pressure_stable.
A dashboard
When it comes to making a dashboard, let alone a weather dashboard, sky is the limit for how much stuff one can put there. I have only just started, so my dashboard is rather modest:
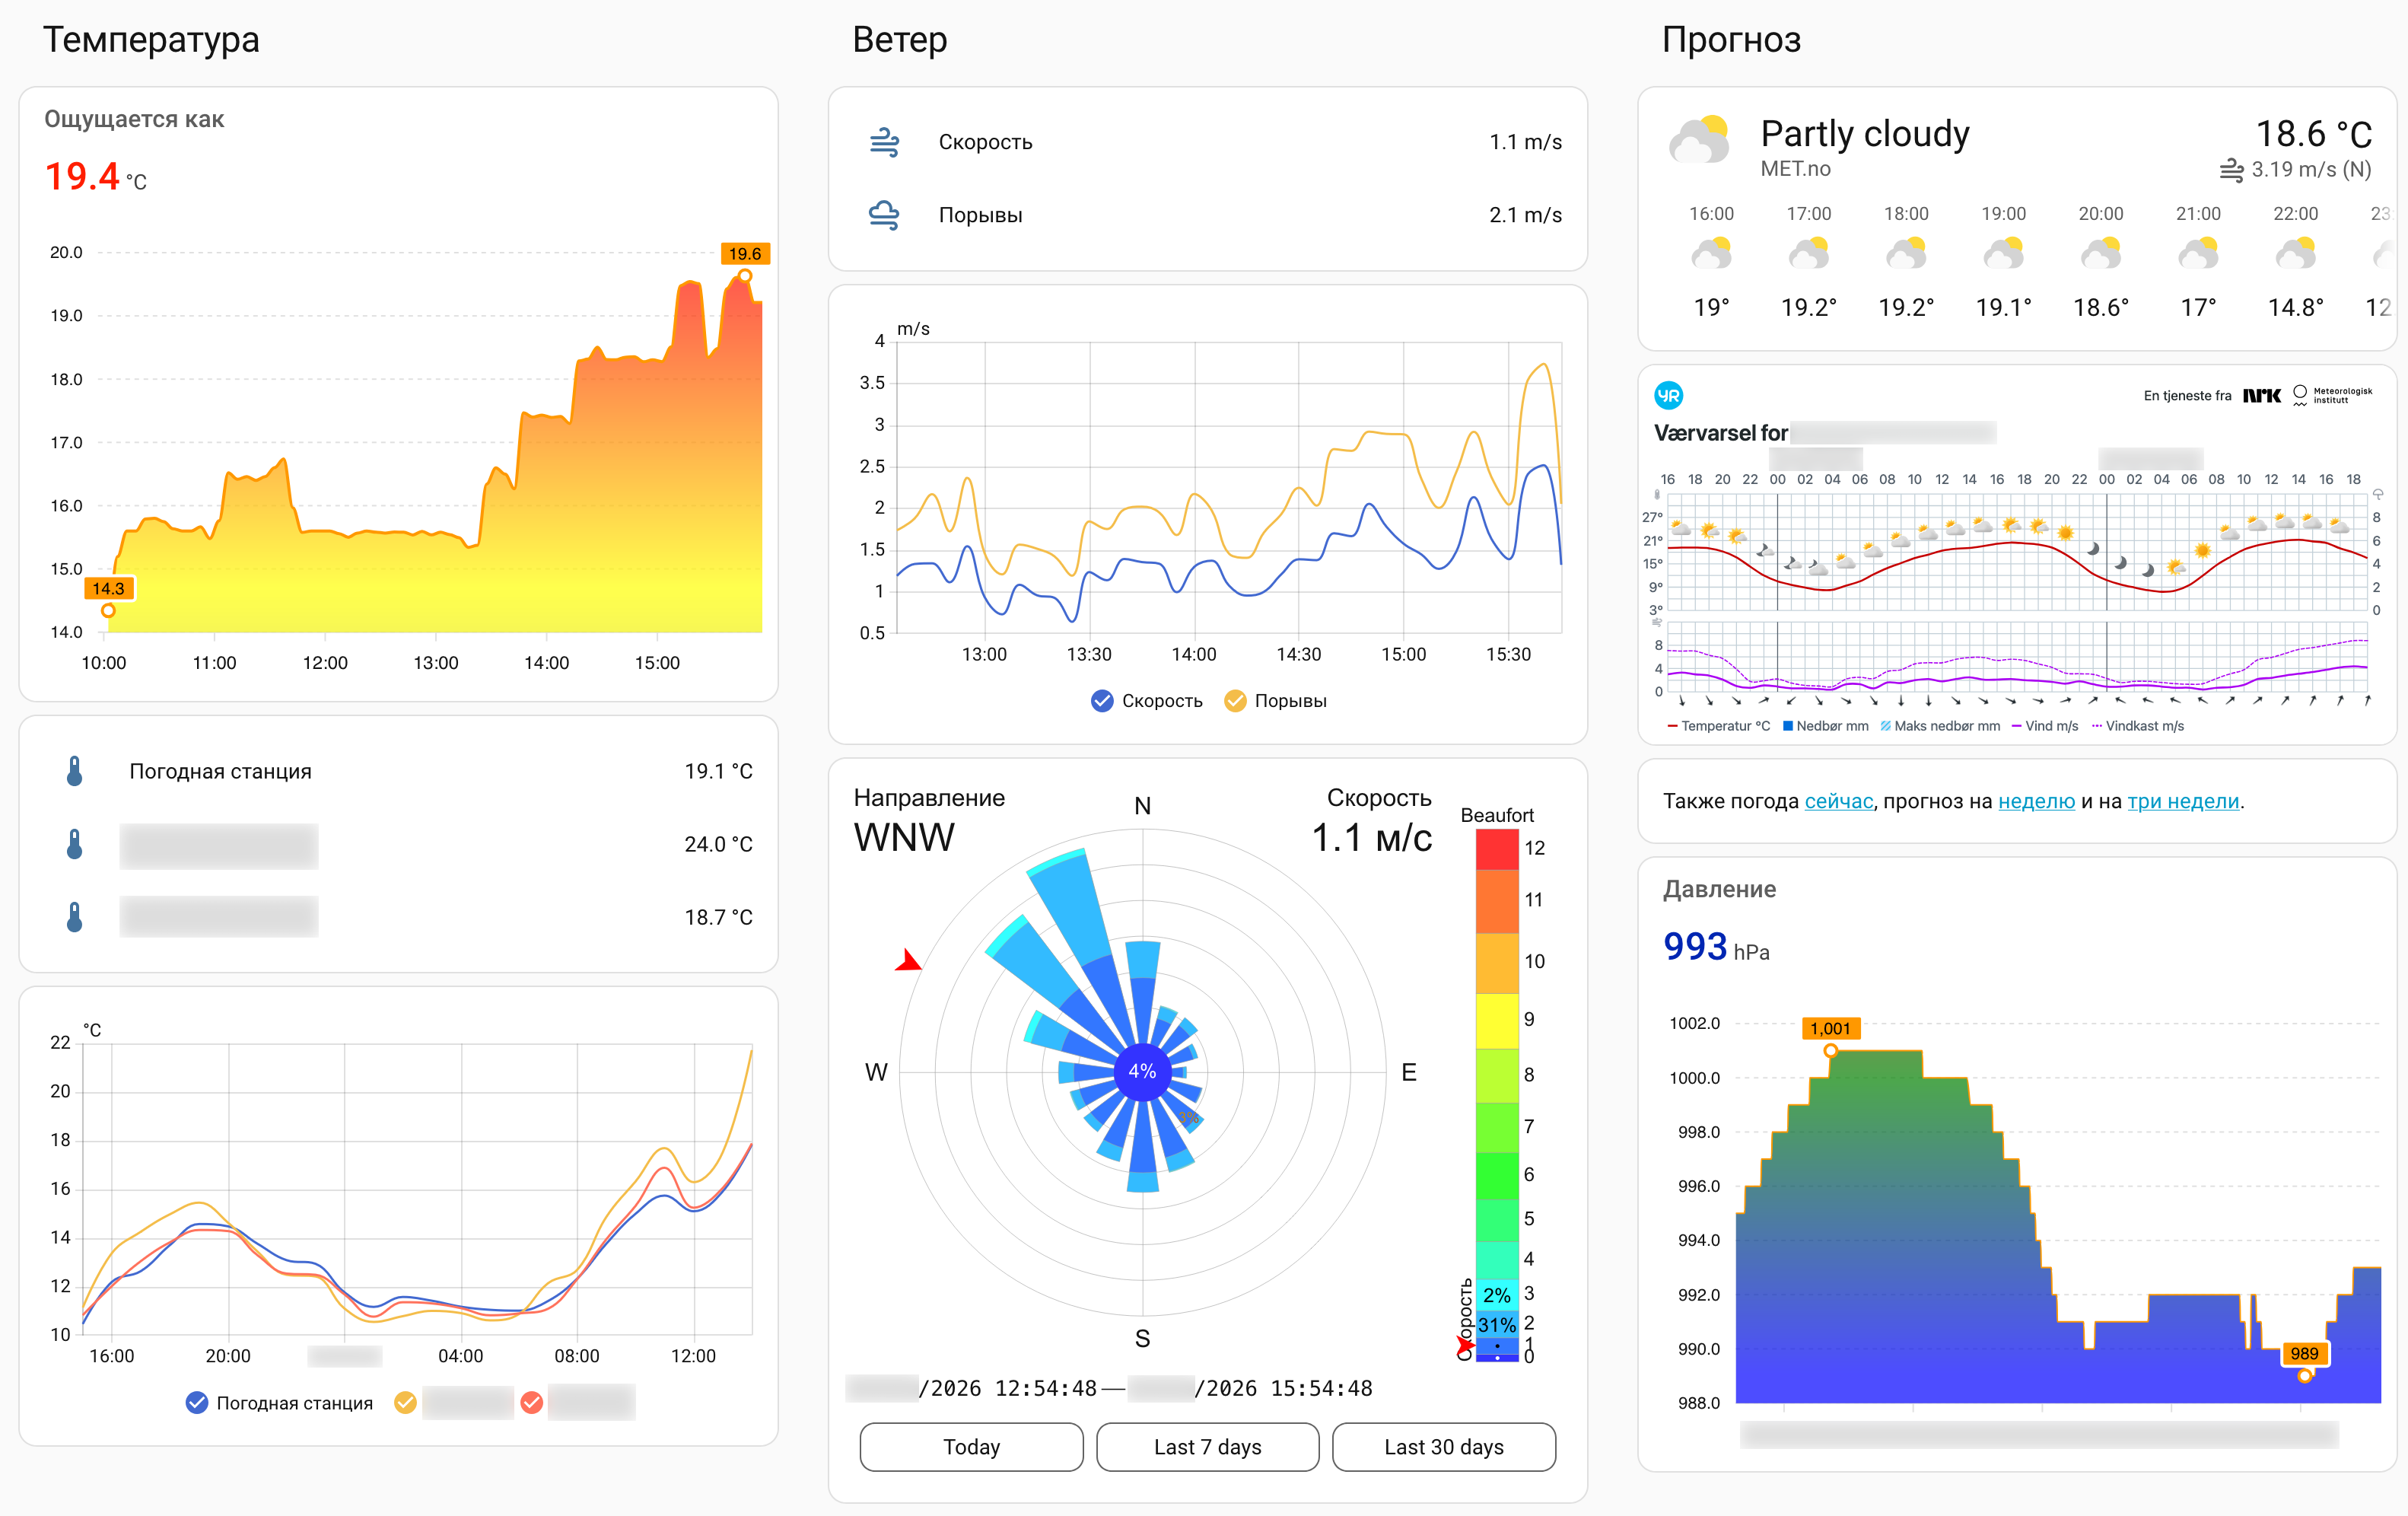
The top-left heatmap-like chart is the apparent temperature - a useful weather metric that is calculated from the actual temperature and wind/humidity. I used the awesome ApexCharts to make it:
type: custom:apexcharts-card
header:
  title: Ощущается как
  show: true
  show_states: true
  colorize_states: true
graph_span: 6h
experimental:
  color_threshold: true
series:
  - entity: sensor.ecowitt_ws90_apparent_temperature
    type: area
    stroke_width: 2
    color_threshold:
      - value: -30
        color: blue
      - value: 15
        color: yellow
      - value: 22
        color: red
    show:
      extremas: true
      header_color_threshold: true
      name_in_header: false
      in_header: raw
    statistics:
      period: 5minute
Same way I made that bottom-right chart for atmospheric pressure:
type: custom:apexcharts-card
header:
  title: Давление, гПа (стабильное, относительное)
  show: true
  show_states: true
  colorize_states: true
graph_span: 120h
experimental:
  color_threshold: true
series:
  - entity: sensor.ecowitt_ws90_pressure_stable_relative
    type: area
    stroke_width: 1
    color_threshold:
      - value: 1000
        color: blue
      - value: 1013
        color: green
      - value: 1020
        color: yellow
      - value: 1030
        color: red
    show:
      extremas: true
      header_color_threshold: true
      name_in_header: false
      in_header: raw
    statistics:
      period: hour
Although it is located in the forecast column, it obviously only shows current and historical data, but it still counts as a forecast metric, because it lets me spot low trends, which indicates higher probability of rain.
The rest of the dashboard is rather trivial, except for maybe that forecast chart (second-from-top card in the right-most column). This one is just a picture card with image pointing to a generated SVG from Yr.no website (very cool feature of theirs). To place it on a dashboard, you can use the following YAML code (with Oslo location ID as an example):
type: picture
image:
  media_content_id: https://yr.no/nb/innhold/1-72837/meteogram.svg
alt_text: Yr.no
grid_options:
  columns: full
tap_action:
  action: url
  url_path: https://yr.no/nb/innhold/1-72837/meteogram.svg
For english variant replace nb/innhold with en/content.
Wind speed forecast chart
Another useful card you might want to add is a chart for wind speed forecast. Naturally, this data has nothing to do with your weather station, as this is a forecast, and conveniently the default(?) weather provider (Met.no) can deliver it, though apparently it is not doing so by default, so you’ll need to add a new template sensor in templates.yaml (assuming that your configuration.yaml has template: !include templates.yaml):
- trigger:
    - platform: time_pattern
      minutes: "/30"
    - platform: homeassistant
      event: start
  action:
    - service: weather.get_forecasts
      target:
        entity_id: weather.forecast_home
      data:
        type: hourly
      response_variable: hourly
  sensor:
    - name: Weather (hourly)
      unique_id: weather_hourly
      state: "{{ now().isoformat() }}"
      attributes:
        forecast: "{{ hourly['weather.forecast_home'].forecast }}"
After reloading/restarting Home Assistant, you should be able to check that it works on the Developer tools page:
{{ state_attr('sensor.weather_hourly', 'forecast')[0] }}
Among the values it reports there are both the wind_speed and the wind_gust_speed, which is great. So then the chart code will look like this:
type: custom:apexcharts-card
stacked: true
graph_span: 20h
span:
  start: hour
  offset: +1h
experimental:
  color_threshold: true
series:
  - entity: sensor.weather_hourly
    name: Скорость ветра
    type: area
    unit: m/s
    data_generator: |
      return entity.attributes.forecast
          .map(p => [new Date(p.datetime).getTime(), p.wind_speed]);
    color: green
    stroke_width: 3
    color_threshold:
      - value: 0
        color: green
      - value: 4
        color: yellow
      - value: 7
        color: red
    show:
      extremas: true
      header_color_threshold: true
  - entity: sensor.weather_hourly
    name: Порывы
    type: area
    unit: m/s
    data_generator: |
      return entity.attributes.forecast
          .map(p => [new Date(p.datetime).getTime(), p.wind_gust_speed]);
    color: red
    stroke_width: 3
    color_threshold:
      - value: 0
        color: green
      - value: 4
        color: yellow
      - value: 7
        color: red
    show:
      extremas: true
      header_color_threshold: true
And here’s a screenshot of the resulting chart:
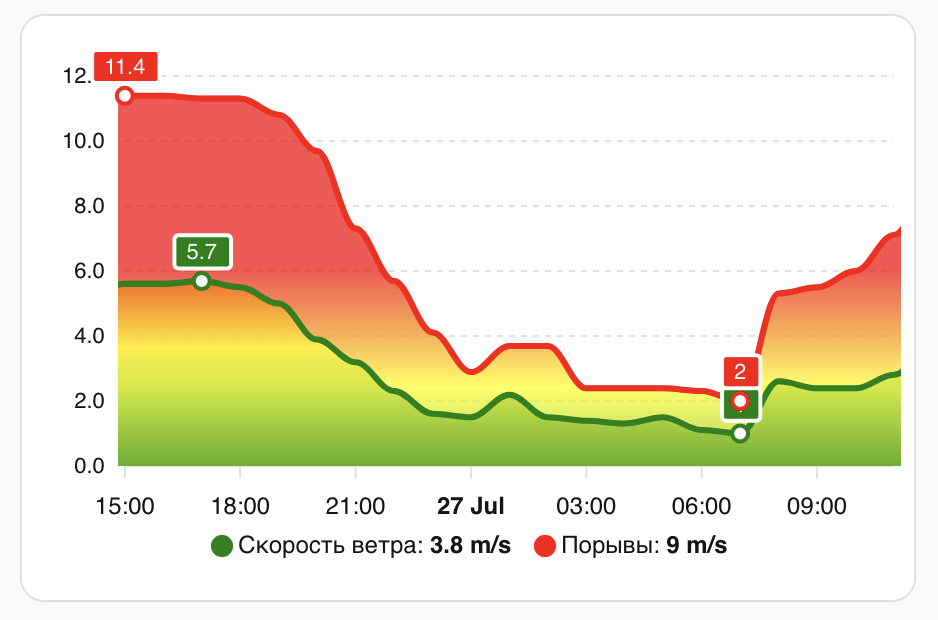
Other weather providers might have this data in a different format - specifically, there will be an example later for how to make a similar chart with Xweather data (though you probably shouldn’t waste your time on that particular service).
Publishing data
We are all for sharing information, right, so wouldn’t it be nice to publish our weather data somewhere on the internet, so other people could use it too. And there are several such weather services where regular users can publish their PWS data.
Aside from altruistic reasons, it would also be nice to get rewarded for submitting your data, something like how FlightAware does it (by granting contributors access to their otherwise paid services). Such a basic thing as being able to see yours and other people stations on an online map would already be a good enough motivation, but surprisingly some services don’t offer even that.
OpenWeatherMap
First one I tried was OpenWeatherMap. By the way, there is also a Home Assistant integration for this service, which lets you add it as a weather data source (though I found their data to be less accurate than the default one).
They have a rather nice API for publishing, but the data you submit is not(?) “visible” to anyone else. There is no map/list of existing users stations, so you cannot look at the data from other stations in your area (and you don’t even know if there are any). You can share your station ID with someone, and then that someone will be able to query your data from OpenWeatherMap service, but that is not at all convenient, is it.
It appears to me that the only use for OpenWeatherMap API is to simply store your data on their servers, so that you could query it later - something I have absolutely no interest in, because I already have all my data locally.
Another thing I didn’t like at first is that every submitting request must contain a timestamp. I thought, why doesn’t it automatically default to the current datatime on the server, is it because API supports batch uploads of historical data? I have no interest in that, I just want to submit my “live” data, and yet I must explicitly send the timestamp too, so annoying. But as I realized later, it actually does make sense to timestamp the data on user side - right at the moment when the measurements were taken - otherwise there will be some delay introduced by client processing and sending, then some more delay from network latency, then some time for data processing on the server, and so in the end the current timestamp on the server will accumulate certain delay from the original moment of taking the measurements - maybe not so much but still something. So yes, user-side timestamping seems to be a better way to go about it.
Publishing is done by sending a POST request, which looks something like:
$ curl -X "POST" "http://api.openweathermap.org/data/3.0/measurements?appid=YOUR-API-KEY" \
     -H 'Content-Type: application/json' \
     -d $'[
  {
    "station_id": "YOUR-STATION-ID",
    "dt": 1780238160,
    "temperature": 18.7,
    "wind_speed": 1,
    "wind_gust": 1.4,
    "humidity": 87,
    "pressure": 998
  }
]'
Not sure about correctness of the units though (can’t compare it with other stations in my area, as they show none).
One last thing to say about OpenWeatherMap is that there are no(?) rewards/bonuses for submitting the data, which, in addition to users stations not being visible to others, drops the motivation of sharing one’s data with OpenWeatherMap to zero. Unless they do use it for improving the weather data in the area, but I did not find a confirmation for that.
Weathercloud
Another weather service is Weathercloud, and this one also has a kind of an “API” for data publishing, though with no official documentation, as it seems. Fortunately, there is this 3rd-party code (and yet another) to be used as an example.
I put “API” into quotes because unlike OpenWeatherMap here the data is submitted via GET requests right in the query string, for example:
$ curl "https://api.weathercloud.net/v01/set?wid=YOUR-ID&key=YOUR-KEY&temp=190&dew=125&wspd=11&wspdhi=14&hum=65&wdir=293&chill=190&uvi=10&bar=9980"
As you’ll see later, that is a pretty common way of submitting the data across different weather services.
Another peculiarity, as you might have noticed in the query string, is that some values are expected to be multiplied by 10. Apparently, that is how they are dealing with floats. Also noteworthy is that timestamp is not required (one example has them in date and time parameters, but the other one does not have them at all), so this service is capable of defaulting to the current timestamp server-side, which might be convenient.
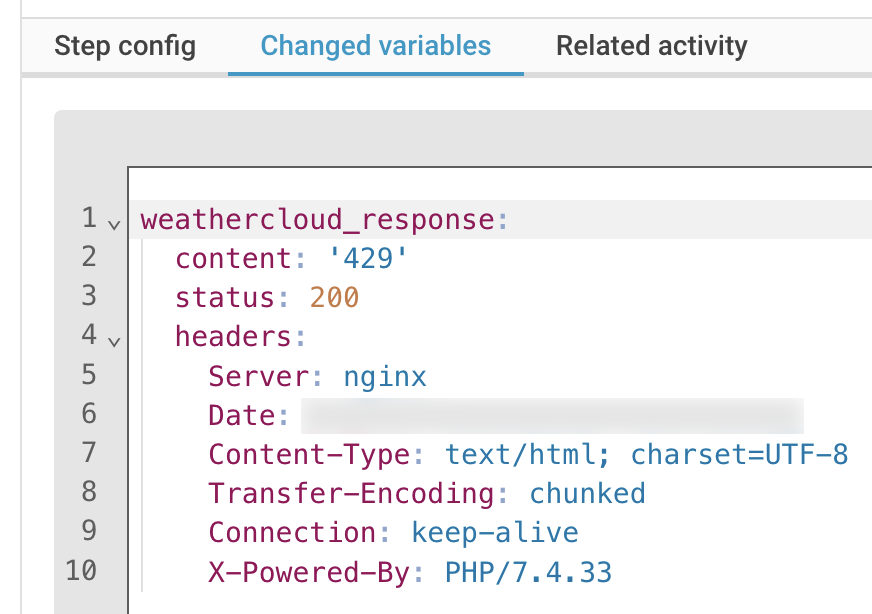
It was also surprising to discover that they have some rate limit, so you will be getting 429 responses if you exceed it. I couldn’t find the exact limit, but sending one request per 10 minutes seems to be okay.
As for how to actually publish weather measurements, it’s just a RESTful command, so you simply add a new inclusion to your configuration.yaml (if you don’t have it there yet):
rest_command: !include rest-commands.yaml
and create a rest-commands.yaml file:
weathercloud_publish:
  url: "https://api.weathercloud.net/v01/set?wid=YOUR-ID&key=YOUR-KEY&temp={{ temp }}&dew={{ dew }}&wspd={{ wspd }}&wspdhi={{ wspdhi }}&wdir={{ wdir }}&chill={{ chill }}&hum={{ hum }}&rain={{ rain }}&rainrate={{ rainrate }}&uvi={{ uvi }}&bar={{ bar }}&software=homeassistant"
  method: GET
  verify_ssl: true
  timeout: 10
Then an automation for calling that weathercloud_publish command every 5 minutes would look like this:
alias: Publish weather data
description: ""
triggers:
  - trigger: time_pattern
    minutes: /5
conditions: []
actions:
  - variables:
      temp: "{{ states('sensor.ecowitt_ws90_temperature') }}"
      dew: "{{ states('sensor.ecowitt_ws90_dew_point') }}"
      wspd: "{{ states('sensor.ecowitt_ws90_wind_speed_ms') }}"
      wspdhi: "{{ states('sensor.ecowitt_ws90_gust_speed') }}"
      wdir: "{{ states('sensor.ecowitt_ws90_wind_direction') }}"
      chill: "{{ states('sensor.ecowitt_ws90_wind_chill') }}"
      hum: "{{ states('sensor.ecowitt_ws90_humidity') }}"
      uvi: "{{ states('sensor.ecowitt_ws90_uv_index') }}"
      bar: "{{ states('sensor.ecowitt_ws90_pressure_stable_relative') }}"
      rain_day: "{{ states('sensor.ecowitt_ws90_rain_meter_day') }}"
      rainrate: "{{ states('sensor.ecowitt_ws90_rain_rate') }}"
  - alias: Publish data to Weathercloud
    action: rest_command.weathercloud_publish
    metadata: {}
    data:
      temp: "{{ (temp | float * 10) | int }}"
      dew: "{{ (dew | float * 10) | int }} "
      wspd: "{{ (wspd | float * 10) | int }}"
      wspdhi: "{{ (wspdhi | float * 10) | int }}"
      wdir: "{{ wdir }}"
      chill: "{{ (chill | float * 10) | int }}"
      hum: "{{ hum }}"
      uvi: "{{ uvi * 10 }}"
      bar: "{{ bar * 10 }}"
      rain: "{{ (rain_day | float * 10) | int }}"
      rainrate: "{{ (rainrate | float * 10) | int }}"
    response_variable: weathercloud_response
mode: single
As you can see, I don’t send the “raw” data right away. The first action collects a set of variables, and only on the second action I pass them to the publishing command. The reason for doing so is because I also publish this same data to several other services, and it is better for all of them to have the exact same values. And as I already mentioned, Weathercloud requires multiplying some values by 10, and for clarity that is better to be done in its own action.
Another thing that is worth pointing out here is that for “volatile” measurements (such as wind speed, wind gust speed and wind direction) it is better to take not the current values but their statistical averages over periods of time - such as for the last 5 minutes as in this example. To do so you’ll need to create statistics helpers, where for measurements like wind speeds the state_characteristic would be average_linear and for measurements like wind direction it would be mean_circular. For example, here are the raw and 5 minutes average wind direction measurements on the same chart:
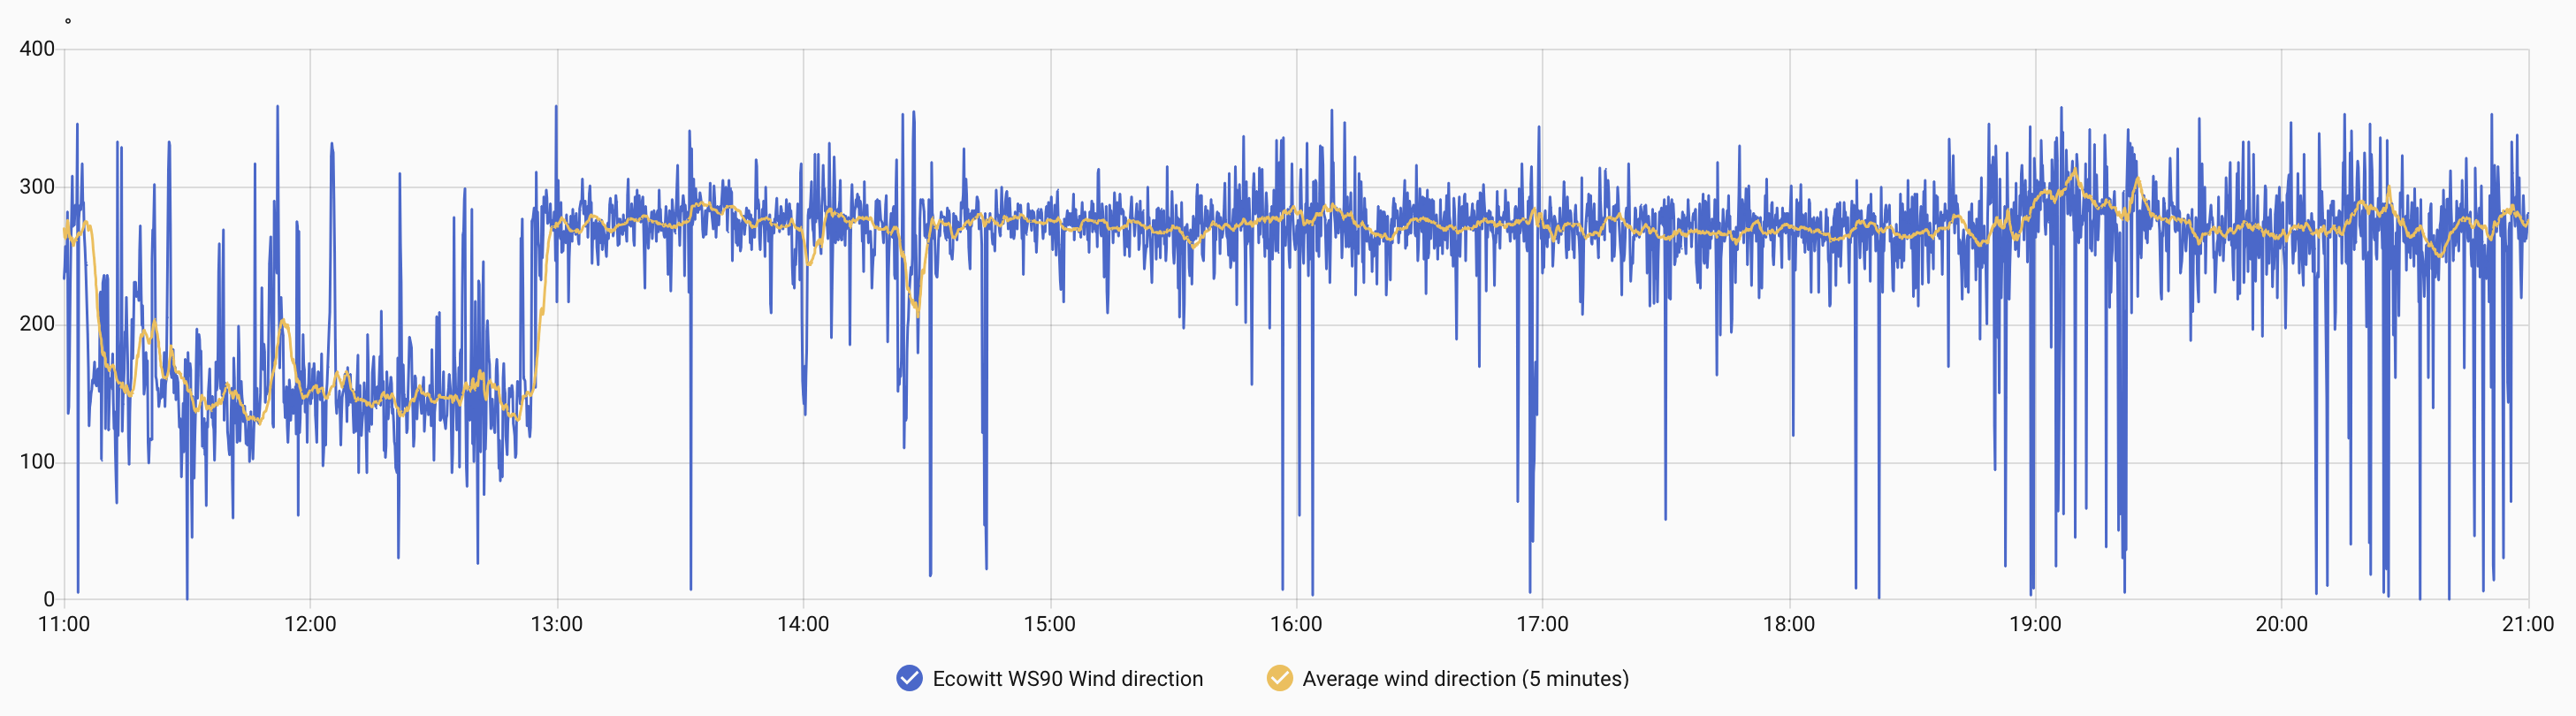
Clearly, the average value (orange line) is a much better candidate for publishing to weather services than the raw measurements (blue line).
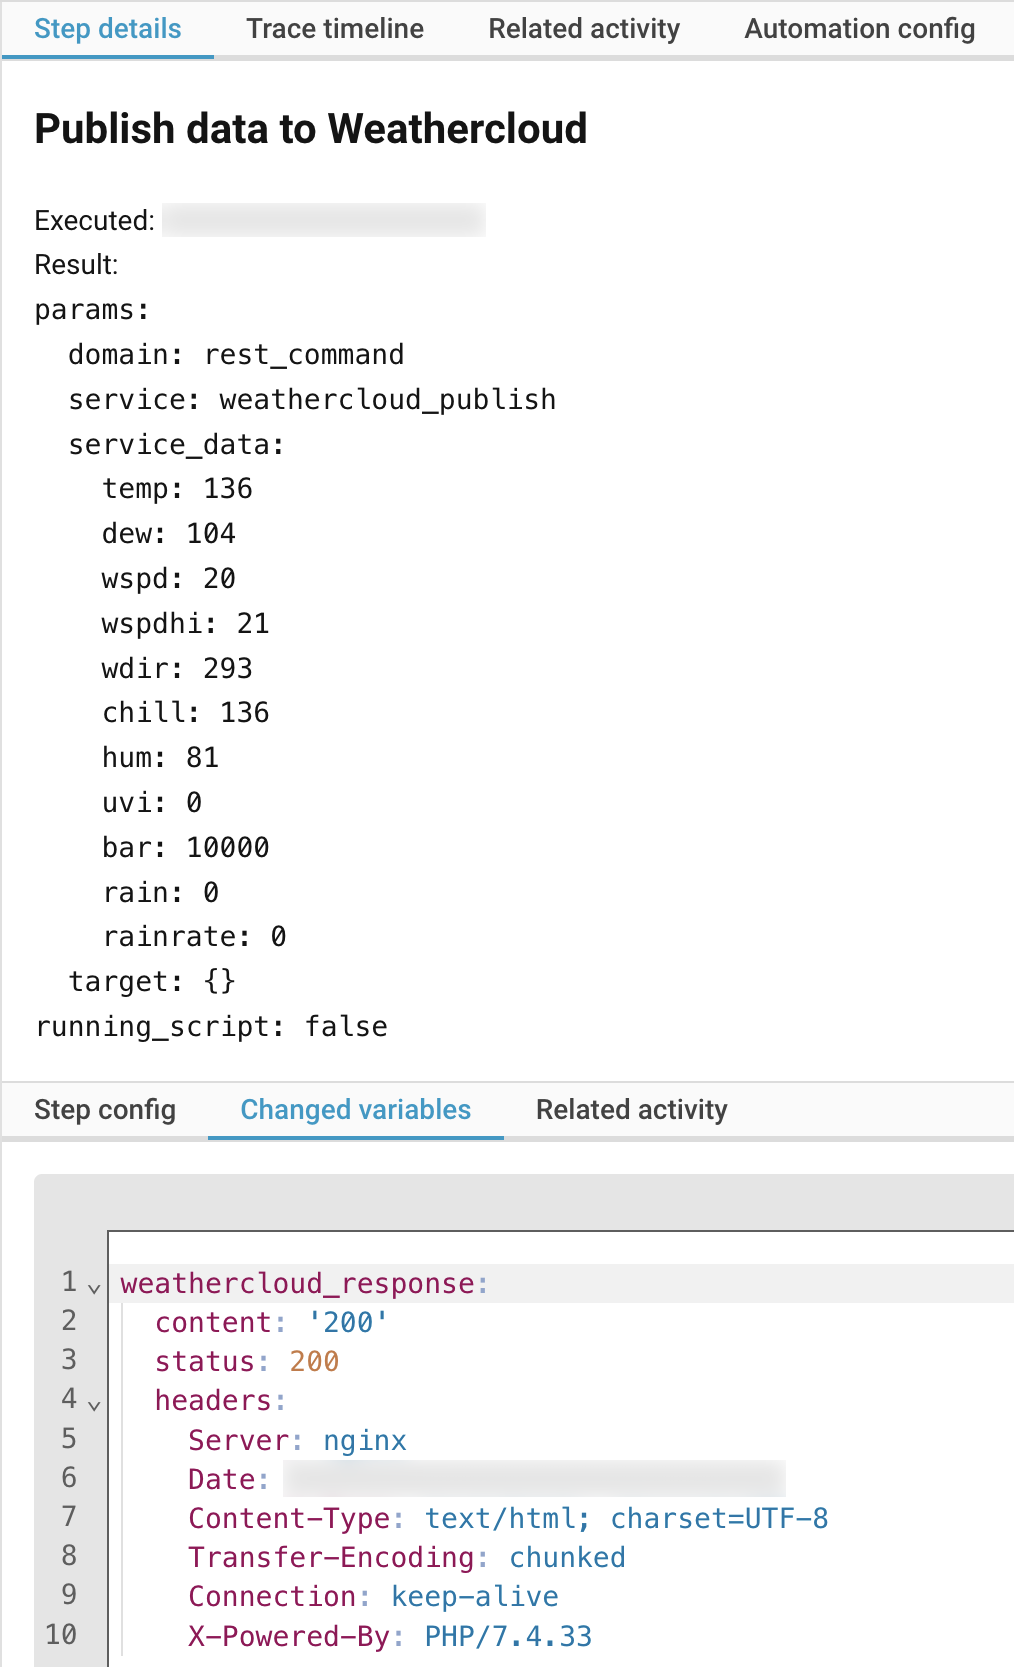
For debugging purposes Home Assistant offers so-called traces, which I have never used before, but now this feature becomes super useful, because it lets you see the actual values you have sent to the service and also inspect their server response:
While we are here, if/when you’ll exceed their rate limit - and with my automation trigger you will, because it is set to run every 5 minutes - then the status value will be still 200, and the actual status will be in the content - the '429' value:
Fucking hell. Это же личерали двухсотка-додик.
Just like OpenWeatherMap, Weathercloud also does not(?) reward users for sharing the data, but they do have public pages for yours and other users stations, and you can look for nearby stations on the map. As a bonus, you can also get a nice HTML widget for any station:
<a href="https://app.weathercloud.net/d0310726209">
    <img src="https://app.weathercloud.net/device/sticker/0310726209">
</a>
but the problem with this widget is that “X minutes ago” might be from a cached image, so it would be better if they just stated the exact date and time there.
Quite naturally, you can also add this widget to your dashboard with a picture card:
type: picture
image:
  media_content_id: https://app.weathercloud.net/device/sticker/0310726209
alt_text: Weathercloud
grid_options:
  columns: full
tap_action:
  action: url
  url_path: https://app.weathercloud.net/d0310726209
Weather Underground
Next service I found was Weather Underground. Same as with Weathercloud, they have the same kind of “API”, and there is a description/example in the same repository (and here too). As for the official documentation, it seems that they (and other services?) use a so-called PWS upload protocol.
This time providing a timestamp parameter (dateutc) is required, otherwise requests will be failing with 400 Bad Request. The dateutc parameter is required even on their rtupdate endpoint (“RapidFire Updates”), which also has a realtime=1 parameter, so it might be surprising why timestamp is still required there, but as I already mentioned earlier, it actually does make sense.
Speaking about the endpoint, here it is in the rest-commands.yaml:
weatherunderground_publish:
  url: "https://rtupdate.wunderground.com/weatherstation/updateweatherstation.php?ID=YOUR-STATION-ID&PASSWORD=YOUR-PASSWORD&dateutc={{ dateutc }}&tempf={{ tempf }}&uv={{ uv }}&windspeedmph={{ windspeedmph }}&windgustmph={{ windgustmph }}&winddir={{ winddir }}&baromin={{ baromin }}&dewptf={{ dewptf }}&humidity={{ humidity }}&rainin={{ rainin }}&dailyrainin={{ dailyrainin }}&softwaretype=homeassistant&realtime=1&rtfreq=300"
  method: GET
  verify_ssl: true
  timeout: 10
The rtfreq=300 indicates that I am posting updates once per 5 minutes, which is what my automation trigger is set to, as you saw in Weathercloud section. Not sure why they need this frequency information, can’t they calculate it themselves? And what will happen if I will be posting data more/less frequently or even at random rate?
As for other parameters, this is a true US/NA moment, because temperature is in Fahrenheit, wind speed is in miles per hour, rain is in goddamn inches, pressure is in fucking inches of mercury and so on:

All of those autistic (they are called “imperial”) units required creating even more templated sensors for conversion (in hindsight, I probably should have just converted them in-place). The conversion formulas are the following:
- Celsius to Fahrenheit:
m/stomph:
km/htomph:
mmtoin(andmmHgtoinHg, obviously):
The updated variables action now looks like this:
variables:
  datetime_utc: "{{ utcnow().strftime('%Y-%m-%d %H:%M:%S') }}"
  temp: "{{ states('sensor.ecowitt_ws90_temperature') }}"
  temp_f: "{{ states('sensor.ecowitt_ws90_temperature_f') }}"
  dew: "{{ states('sensor.ecowitt_ws90_dew_point') }}"
  dew_f: "{{ states('sensor.ecowitt_ws90_dew_point_f') }}"
  wspd: "{{ states('sensor.ecowitt_ws90_wind_speed_ms') }}"
  wspd_mph: "{{ states('sensor.ecowitt_ws90_wind_speed_mph') }}"
  wspdhi: "{{ states('sensor.ecowitt_ws90_gust_speed') }}"
  wspdhi_mph: "{{ states('sensor.ecowitt_ws90_gust_speed_mph') }}"
  wdir: "{{ states('sensor.ecowitt_ws90_wind_direction') }}"
  chill: "{{ states('sensor.ecowitt_ws90_wind_chill') }}"
  hum: "{{ states('sensor.ecowitt_ws90_humidity') }}"
  uvi: "{{ states('sensor.ecowitt_ws90_uv_index') }}"
  bar: "{{ states('sensor.ecowitt_ws90_pressure_stable_relative') }}"
  bar_mm_hg: "{{ states('sensor.ecowitt_ws90_pressure_mmhg') }}"
  bar_in_hg: "{{ states('sensor.ecowitt_ws90_pressure_inhg') }}"
  rain_hour: "{{ states('sensor.ecowitt_ws90_rain_meter_hour') }}"
  rain_day: "{{ states('sensor.ecowitt_ws90_rain_meter_day') }}"
  rainrate: "{{ states('sensor.ecowitt_ws90_rain_rate') }}"
And here’s the new action for publishing to Weather Underground:
- alias: Publish data to Weather Underground
  action: rest_command.weatherunderground_publish
  metadata: {}
  data:
    dateutc: "{{ datetime_utc | urlencode }}"
    tempf: "{{ temp_f }}"
    windspeedmph: "{{ wspd_mph }} "
    windgustmph: "{{ wspdhi_mph }}"
    winddir: "{{ wdir }}"
    uv: "{{ uvi }}"
    baromin: "{{ bar_in_hg }}"
    rainin: "{{ (rain_hour | float / 25.4) | round(4) }}"
    dailyrainin: "{{ (rain_day | float / 25.4) | round(4) }}"
    dewptf: "{{ dew_f }}"
    humidity: "{{ hum }}"
  response_variable: weatherunderground_response
You can see there how some values are taken from templated sensors while others (rainin, dailyrainin) are simply converted in-place.
The service doesn’t seem to have a rate limit, but I haven’t tried sending requests more often than once per minute.
As for rewards, in addition to a nice map and public stations pages, apparently they also disable ads on the website, or at least my membership section on the profile page says that I now have the PWS Ad Free status, and the subscription page also says that my current plan is PWS Ad Free Membership with the following description:
Keep zapping the ads out of your forecast. Send us data from your personal weather station or subscribe to a paid plan.
If anything, I didn’t see any ads even before I got this status, but that is probably thanks to my uBlock Origin.
Aside from the ads-free website, I can now get a key for their “APIs for contributors” (which is documented in Google Docs, lol), and with that I can add other weather stations to my Home Assistant via this integration, so that is useful too.
Lastly, if you will be publishing your data consistently, and if it won’t contradict measurements from other stations in the area, then in about 5 days you will get a gold star badge for your station:

PWSWeather
As far as website design goes, the PWSWeather has probably the most nice looking website of them all. As for the publishing API, it is almost the same as in Weather Underground, so here’s what goes into rest-commands.yaml:
pwsweather_publish:
  url: "https://pwsupdate.pwsweather.com/api/v1/submitwx?ID=YOUR-STATION-ID&PASSWORD=YOUR-API-KEY&dateutc={{ dateutc }}&winddir={{ winddir }}&windspeedmph={{ windspeedmph }}&windgustmph={{ windgustmph }}&tempf={{ tempf }}&rainin={{ rainin }}&dailyrainin={{ dailyrainin }}&baromin={{ baromin }}&dewptf={{ dewptf }}&humidity={{ humidity }}&uv={{ uv }}&softwaretype=homeassistant&action=updateraw"
  method: GET
  verify_ssl: true
  timeout: 10
The difference is that there are no realtime and rtfreq parameters, but there is this new action=updateraw parameter. If anything, the query is also described in those same 3rd-party repositories here and there.
Just like with Weather Underground, the measurements are accepted in the same autistic imperial units. Good thing that I already had all of those in my variables action, so the action for PWSWeather is basically a copy-paste from Weather Underground:
alias: Publish data to PWSWeather
action: rest_command.pwsweather_publish
metadata: {}
data:
  dateutc: "{{ datetime_utc | urlencode }}"
  tempf: "{{ temp_f }}"
  windspeedmph: "{{ wspd_mph }} "
  windgustmph: "{{ wspdhi_mph }}"
  winddir: "{{ wdir }}"
  uv: "{{ uvi }}"
  baromin: "{{ bar_in_hg }}"
  rainin: "{{ (rain_hour | float / 25.4) | round(4) }}"
  dailyrainin: "{{ (rain_day | float / 25.4) | round(4) }}"
  dewptf: "{{ dew_f }}"
  humidity: "{{ hum }}"
response_variable: pwsweather_response
Since rainin and dailyrainin are now used in more than one place, it makes sense to move them to a common variables action too, so they wouldn’t get calculated more than once.
Another thing I realized that needs adding for every service (except for maybe the last one) is continue_on_error: true, because if the first one in line (Weathercloud) fails to send the request (as it often does due to timeouts and 502 errors), then none of the next actions will execute.
So here are the updates:
alias: Publish weather data
description: ""
triggers:
  - trigger: time_pattern
    minutes: /5
conditions: []
actions:
  - variables:
      datetime_utc: "{{ utcnow().strftime('%Y-%m-%d %H:%M:%S') }}"
      # ...
      rain_hour: "{{ states('sensor.ecowitt_ws90_rain_meter_hour') }}"
      rain_day: "{{ states('sensor.ecowitt_ws90_rain_meter_day') }}"
      # ...
  - variables:
      rainin: "{{ (rain_hour | float / 25.4) | round(4) }}"
      dailyrainin: "{{ (rain_day | float / 25.4) | round(4) }}"
  # ...
  - alias: Publish data to Weathercloud
    action: rest_command.weathercloud_publish
    # ...
    continue_on_error: true
  - alias: Publish data to Weather Underground
    action: rest_command.weatherunderground_publish
    data:
      dateutc: "{{ datetime_utc | urlencode }}"
      # ...
      rainin: "{{ rainin }}"
      dailyrainin: "{{ dailyrainin }}"
      # ...
    continue_on_error: true
  - alias: Publish data to PWSWeather
    action: rest_command.pwsweather_publish
    data:
      dateutc: "{{ datetime_utc | urlencode }}"
      # ...
      rainin: "{{ rainin }}"
      dailyrainin: "{{ dailyrainin }}"
      # ...
    # ...
# ...
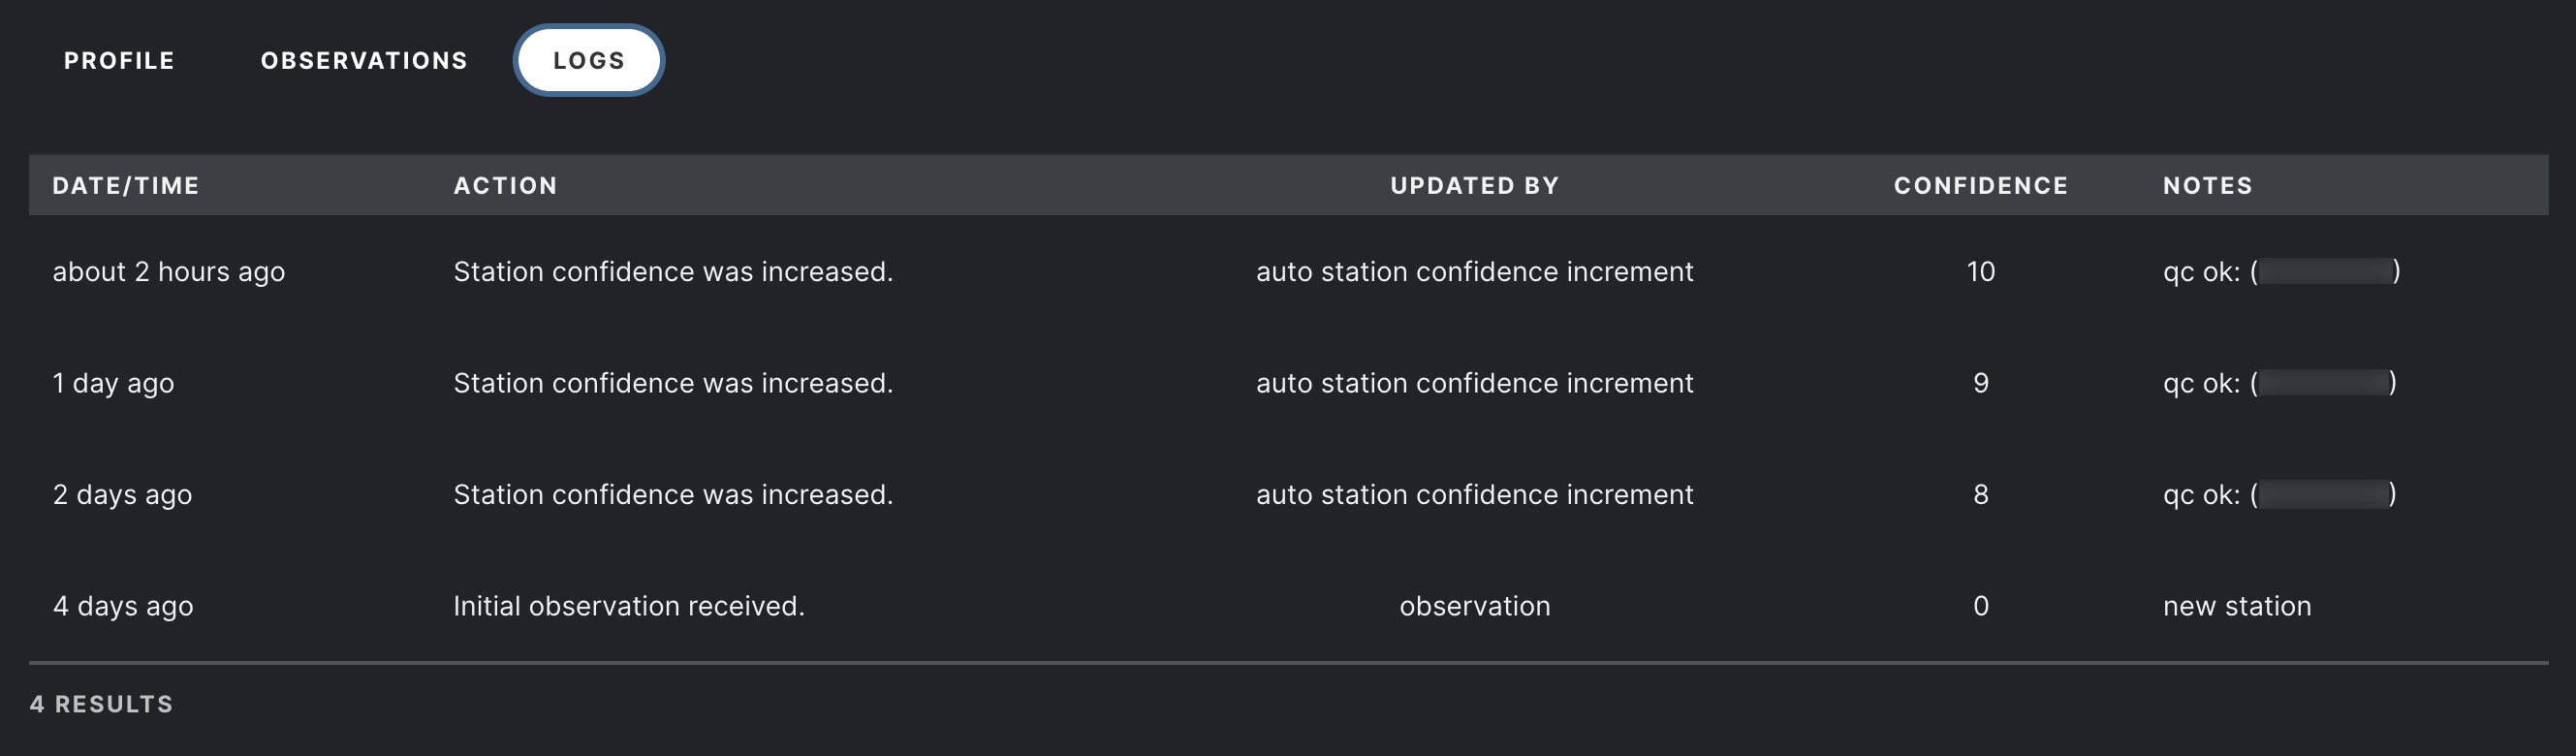
Once you start publishing the data, it will get logged on your private account page right away, but the station itself will not be visible to other users just yet. As it is explained in the FAQ, first your station will have Initiating status for up to 5 days, and then, if your data passes quality control, it will get Active status and will become visible to other users on the map. It will also have a “confidence level” metric, which varies from 0 to 10, and you can see how it changes for your station in the logs:
When it comes to rewards/motivation for sharing your data, then aside from nice looking public pages for users stations and the map, they also provide an API subscription plan for contributors (“valued at $400+”, as they claim):
Through the Contributor Plan you also have an option to leverage AerisWeather’s powerful API and Maps.
They still call it AerisWeather, but actually it is Vaisala Xweather (since 2022).
Trying to use Xweather API
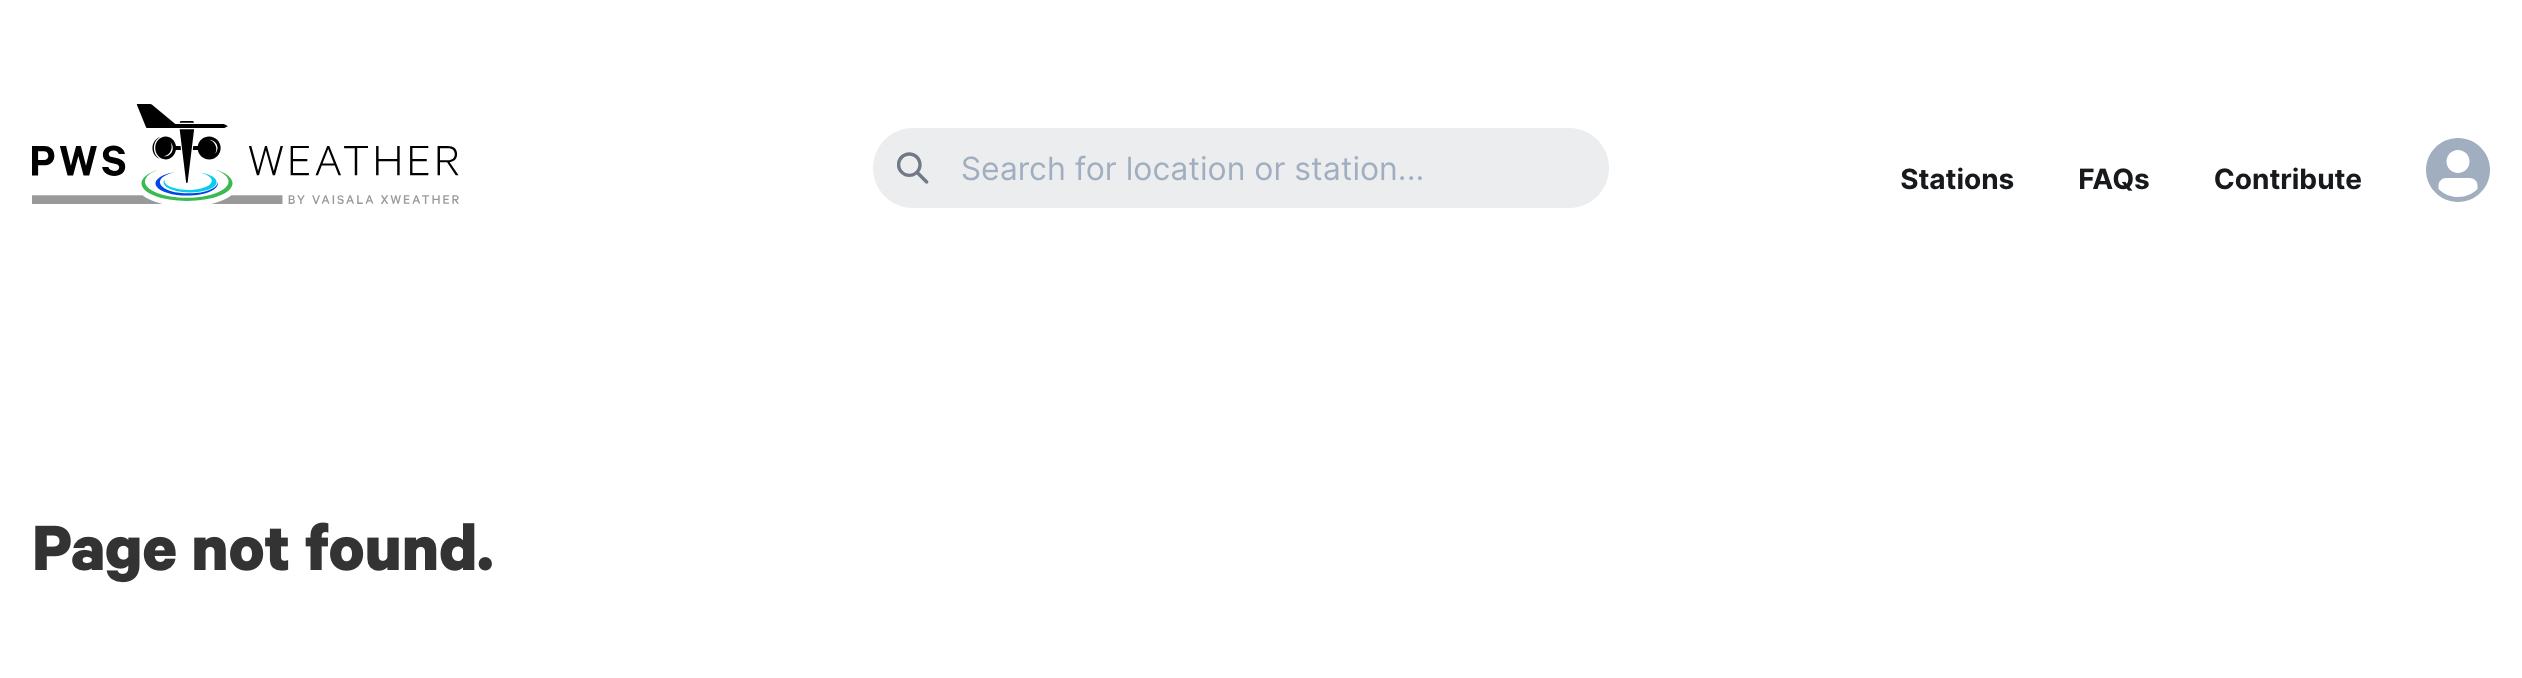
Even though PWSWeather claims that contributors get a special subscription plan, I couldn’t find how to get it. I think I saw somewhere that you only need to register an Xweather account with the same e-mail that you have on PWSWeather, and I did so, but I still don’t see that Contributor Plan available anywhere. I sent a question about that to support@xweather.com, but never got a reply. There is also a support page linked at the bottom of the Account page, but it returns 404:
All that doesn’t speak very highly of them, but they also have a free of charge Developer subscription plan (available to anyone regardless of sharing the data), so for now I tried to use that one. It seems to be severely crippled by the daily requests quota, so you can’t really use it for getting maps imagery, but it is enough for getting basic forecasts.
What’s convenient about their forecasts data is that you can make a proper weather entity and use it as the source for weather forecast cards.
The data from API will be fetched via RESTful integration. If you never had one before, then add it in configuration.yaml:
rest: !include rest.yaml
and then in rest.yaml:
# current conditions
- resource: "https://data.api.xweather.com/conditions"
  params:
    p: !secret xweather_location
    client_id: !secret xweather_client_id
    client_secret: !secret xweather_client_secret
    format: json
  scan_interval: 900
  sensor:
    - name: "Xweather Current"
      value_template: "{{ value_json.response[0].periods[0].weatherPrimary }}"
      json_attributes_path: "$.response[0].periods[0]"
      json_attributes:
        - tempC
        - humidity
        - pressureMB
        - windSpeedMPS
        - windGustMPS
        - windDirDEG
        - visibilityKM
        - dewpointC
        - weather

# daily forecast (7 days)
- resource: "https://data.api.xweather.com/forecasts"
  params:
    p: !secret xweather_location
    client_id: !secret xweather_client_id
    client_secret: !secret xweather_client_secret
    format: json
    filter: day
    limit: 7
  scan_interval: 1800
  sensor:
    - name: "Xweather Daily"
      value_template: "{{ value_json.response[0].periods | count }}"
      json_attributes_path: "$.response[0]"
      json_attributes:
        - periods

# hourly forecast (24 hours)
- resource: "https://data.api.xweather.com/forecasts"
  params:
    p: !secret xweather_location
    client_id: !secret xweather_client_id
    client_secret: !secret xweather_client_secret
    format: json
    filter: 1hr
    limit: 24
  scan_interval: 1800
  sensor:
    - name: "Xweather Hourly"
      value_template: "{{ value_json.response[0].periods | count }}"
      json_attributes_path: "$.response[0]"
      json_attributes:
        - periods
Since xweather_location, xweather_client_id and xweather_client_secret are common parameters, it makes sense to re-use them as variables, and one way to do so is by placing them into secrets.yaml:
xweather_location: "YOUT-LATITUDE,YOUR-LONGITUDE"
xweather_client_id: "YOUR-XWEATHER-CLIENT-ID"
xweather_client_secret: "YOUR-XWEATHER-CLIENT-SECRET"
That won’t make them actually “secret”, since this is merely a different plain-text file, but it will make them re-usable variables, which is what we wanted.
Next is to make the weather entity template, and that is a yet another configuration.yaml include (if you don’t have it yet):
template: !include templates.yaml
and then in templates.yaml:
- weather:
  - name: "Xweather"
    unique_id: xweather_template
    condition_template: >
      {% from 'xweather_macros.jinja' import xw_map %}
      {% set c = state_attr('sensor.xweather_current', 'weather') %}
      {{ xw_map(c) }}
    temperature_template: "{{ state_attr('sensor.xweather_current','tempC') | float(0) }}"
    temperature_unit: "°C"
    humidity_template: "{{ state_attr('sensor.xweather_current','humidity') | float(0) }}"
    pressure_template: "{{ state_attr('sensor.xweather_current','pressureMB') | float(0) }}"
    pressure_unit: "hPa"
    wind_speed_template: "{{ state_attr('sensor.xweather_current','windSpeedMPS') | float(0) }}"
    wind_speed_unit: "m/s"
    wind_bearing_template: "{{ state_attr('sensor.xweather_current','windDirDEG') | float(0) }}"
    visibility_template: "{{ state_attr('sensor.xweather_current','visibilityKM') | float(0) }}"
    visibility_unit: "km"
    dew_point_template: "{{ state_attr('sensor.xweather_current','dewpointC') | float(0) }}"
    forecast_daily_template: >
      {% from 'xweather_macros.jinja' import xw_map %}
      {% set periods = state_attr('sensor.xweather_daily','periods') %}
      {% set ns = namespace(out=[]) %}
      {% if periods %}
        {% for p in periods %}
          {% set ns.out = ns.out + [{
            'datetime': p.dateTimeISO,
            'condition': xw_map(p.weatherPrimary),
            'temperature': p.maxTempC | float(0),
            'templow': p.minTempC | float(0),
            'precipitation': p.precipMM | float(0),
            'precipitation_probability': p['pop'] | int(0),
            'wind_speed': p.windSpeedMaxMPS | float(0),
            'wind_gust_speed': p.windGustMPS | float(0),
            'wind_bearing': p.windDirDEG | float(0),
            'humidity': p.humidity | int(0)
          }] %}
        {% endfor %}
      {% endif %}
      {{ ns.out }}
    forecast_hourly_template: >
      {% from 'xweather_macros.jinja' import xw_map %}
      {% set periods = state_attr('sensor.xweather_hourly','periods') %}
      {% set ns = namespace(out=[]) %}
      {% if periods %}
        {% for p in periods %}
          {% set ns.out = ns.out + [{
            'datetime': p.dateTimeISO,
            'condition': xw_map(p.weatherPrimary),
            'temperature': p.tempC | float(0),
            'precipitation': p.precipMM | float(0),
            'precipitation_probability': p['pop'] | int(0),
            'wind_speed': p.windSpeedMPS | float(0),
            'wind_gust_speed': p.windGustMPS | float(0),
            'wind_bearing': p.windDirDEG | float(0),
            'humidity': p.humidity | int(0),
            'pressure': p.pressureMB | float(0)
          }] %}
        {% endfor %}
      {% endif %}
      {{ ns.out }}
The xw_map() is a macro for mapping the Xweather conditions to Home Assistant weather conditions. It lives in the custom_templates/xweather_macros.jinja file:
├── custom_templates
│   └── xweather_macros.jinja
├── ...
├── configuration.yaml
├── rest-commands.yaml
├── rest.yaml
├── secrets.yaml
├── templates.yaml
├── ...
with the contents:
{% macro xw_map(w) %}
{%- set w = (w | string | lower) -%}
{%- if 'thunder' in w or 'tstorm' in w -%}lightning-rainy
{%- elif 'snow' in w or 'flurries' in w or 'wintry' in w -%}snowy
{%- elif 'sleet' in w or 'ice' in w or 'freezing' in w -%}snowy-rainy
{%- elif 'rain' in w or 'showers' in w or 'drizzle' in w -%}rainy
{%- elif 'hail' in w -%}hail
{%- elif 'fog' in w or 'haze' in w or 'mist' in w -%}fog
{%- elif 'wind' in w -%}windy
{%- elif 'overcast' in w or 'cloudy' in w -%}cloudy
{%- elif 'partly' in w or 'mostly sunny' in w or 'mostly clear' in w -%}partlycloudy
{%- elif 'clear' in w or 'sunny' in w or 'fair' in w -%}sunny
{%- else -%}exceptional
{%- endif -%}
{% endmacro %}
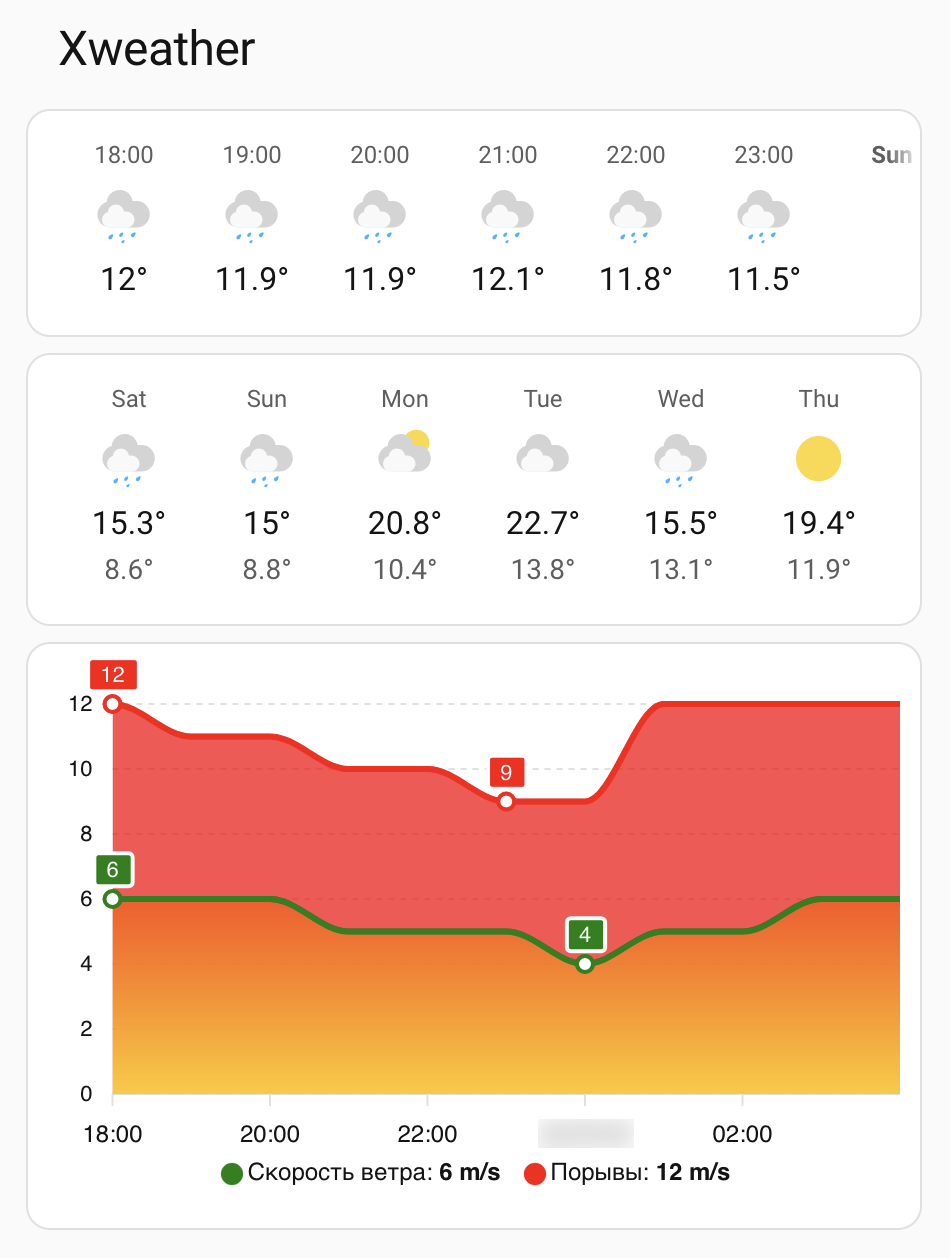
Putting it all together, here are weather cards for the hourly and daily forecasts along with the expected wind speeds:
type: vertical-stack
title: Xweather
cards:
  - show_current: false
    show_forecast: true
    type: weather-forecast
    entity: weather.xweather
    forecast_type: hourly
    round_temperature: false
    secondary_info_attribute: wind_speed
    forecast_slots: 9
  - show_current: false
    show_forecast: true
    type: weather-forecast
    entity: weather.xweather
    forecast_type: daily
    round_temperature: false
    secondary_info_attribute: wind_speed
    forecast_slots: 6
    tap_action:
      action: url
      url_path: https://pwsweather.com/station/forecast/pws/YOUR-STATION-ID/
  - type: custom:apexcharts-card
    stacked: true
    graph_span: 10h
    span:
      start: hour
      offset: +1h
    experimental:
      color_threshold: true
    series:
      - entity: sensor.xweather_hourly
        name: Скорость ветра
        type: area
        unit: m/s
        data_generator: |
          return entity.attributes.periods
            .slice(0, 10)
            .map(p => [p.timestamp * 1000, p.windSpeedMPS]);
        color: green
        stroke_width: 3
        color_threshold:
          - value: 0
            color: green
          - value: 4
            color: yellow
          - value: 7
            color: red
        show:
          extremas: true
          header_color_threshold: true
      - entity: sensor.xweather_hourly
        name: Порывы
        type: area
        unit: m/s
        data_generator: |
          return entity.attributes.periods
            .slice(0, 10)
            .map(p => [p.timestamp * 1000, p.windGustMPS]);
        color: red
        stroke_width: 3
        color_threshold:
          - value: 0
            color: green
          - value: 4
            color: yellow
          - value: 7
            color: red
        show:
          extremas: true
          header_color_threshold: true
grid_options:
  columns: full
which will look like this:
It worked fine for about a week, but then Home Assistant entity stopped getting new data. Trying to find the reason, I sent a plain request with cURL, and the result was 401 error with the following response:
{
    "success": false,
    "error":
    {
        "code": "insufficient_scope",
        "description": "The client provided is not authorized to access the request."
    },
    "response": []
}
I went to my Xweather account page to check the usage, suspecting that I might have exceeded the quota somehow (even though the amount of requests was the same every day - well within the limits), but no, it turned out that Xweather just deleted my subscription:

There were no warnings, not a single notification, not even a record in the activity log, they just silently cancelled/deleted my Developer subscription and its API key.
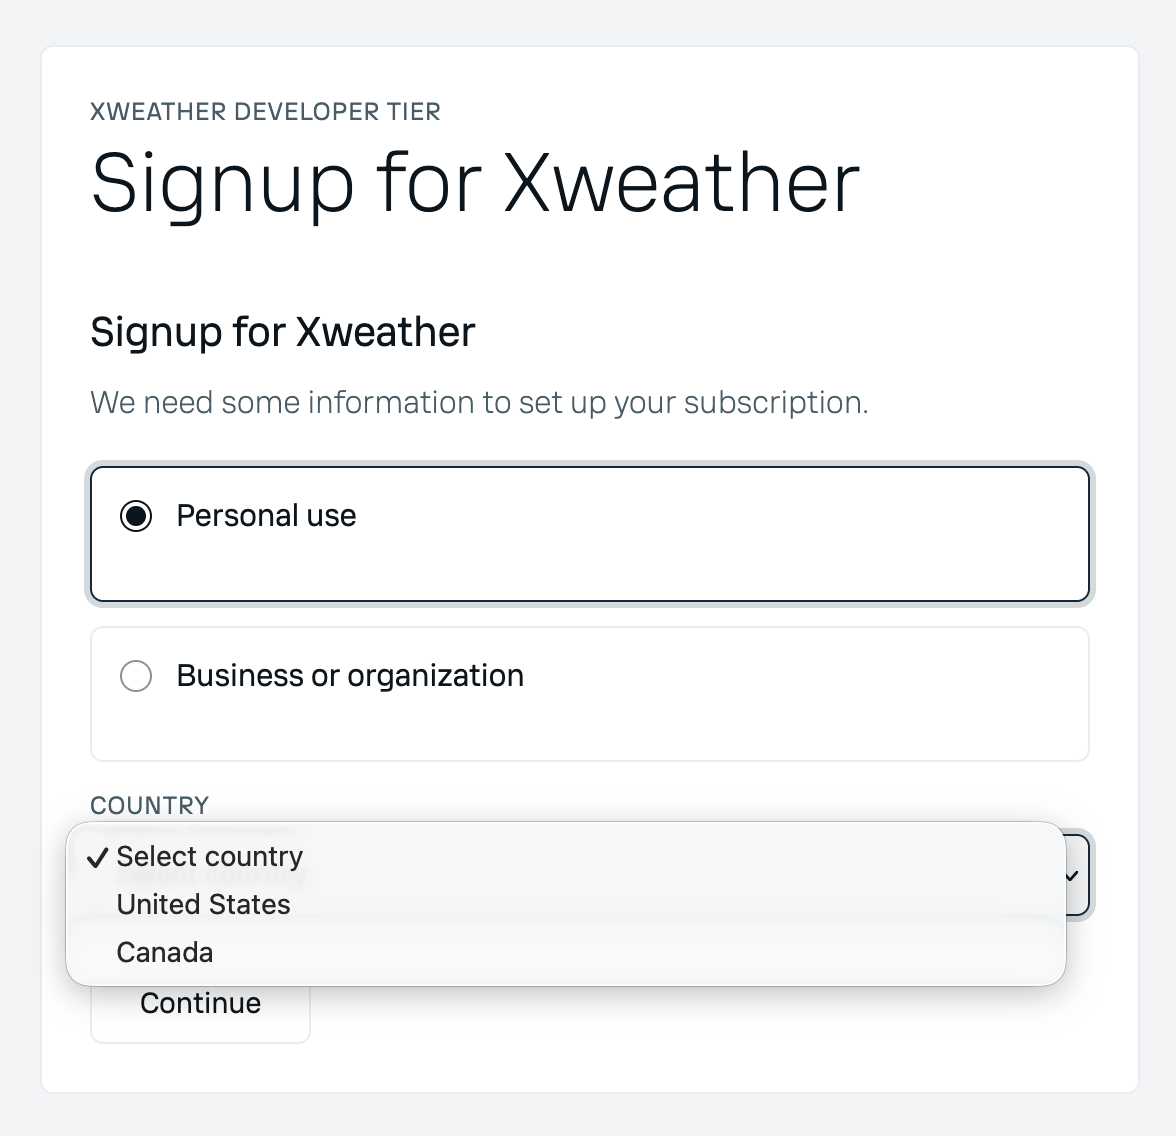
Okay, I thought, I’ll just get a new one and will see how long will that one last. So I clicked on that Start with a free developer plan and it brought me to the main subscription page again. There I clicked on Get started for free in Developer section, and that got me to this page where all of a sudden I could only select United States or Canada:
…even though I got here from the page where “Outside the US and Canada” was selected and the prices were listed in euro. I tried proceeding first with United States and then with Canada, but both attempts resulted in an error with a button for contacting support:
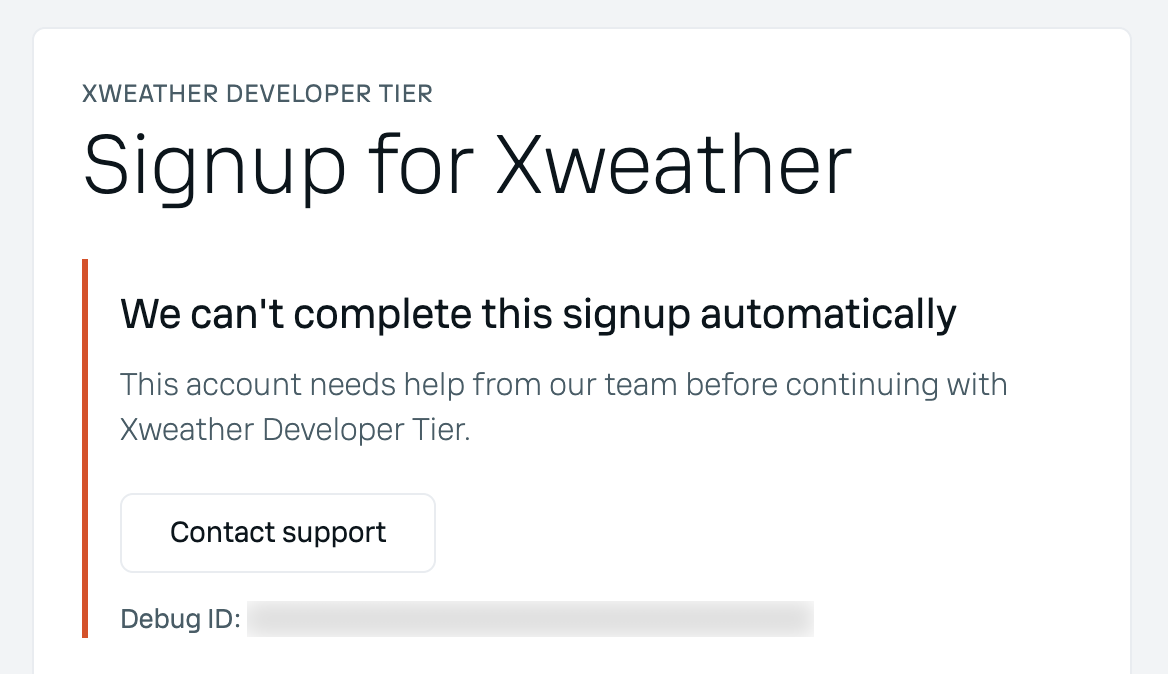
…which doesn’t fucking work. You can click on that button one thousand times, but nothing will happen, not even an error will be printed to the browser console.
So I can only conclude that PWSWeather/Xweather Contributor Plan is a goddamn lie (“valued at $400+”, my ass). And that despite having a subscription tier named exactly “Developer”, in practice the service couldn’t give two shits about developers. Hell, they can’t even be bothered with fixing 404 pages and contact buttons, not to mention support@xweather.com address just outright ignoring your e-mails. Просто иди на хуй - вот такого уровня этот сервис.
Яндекс Погода
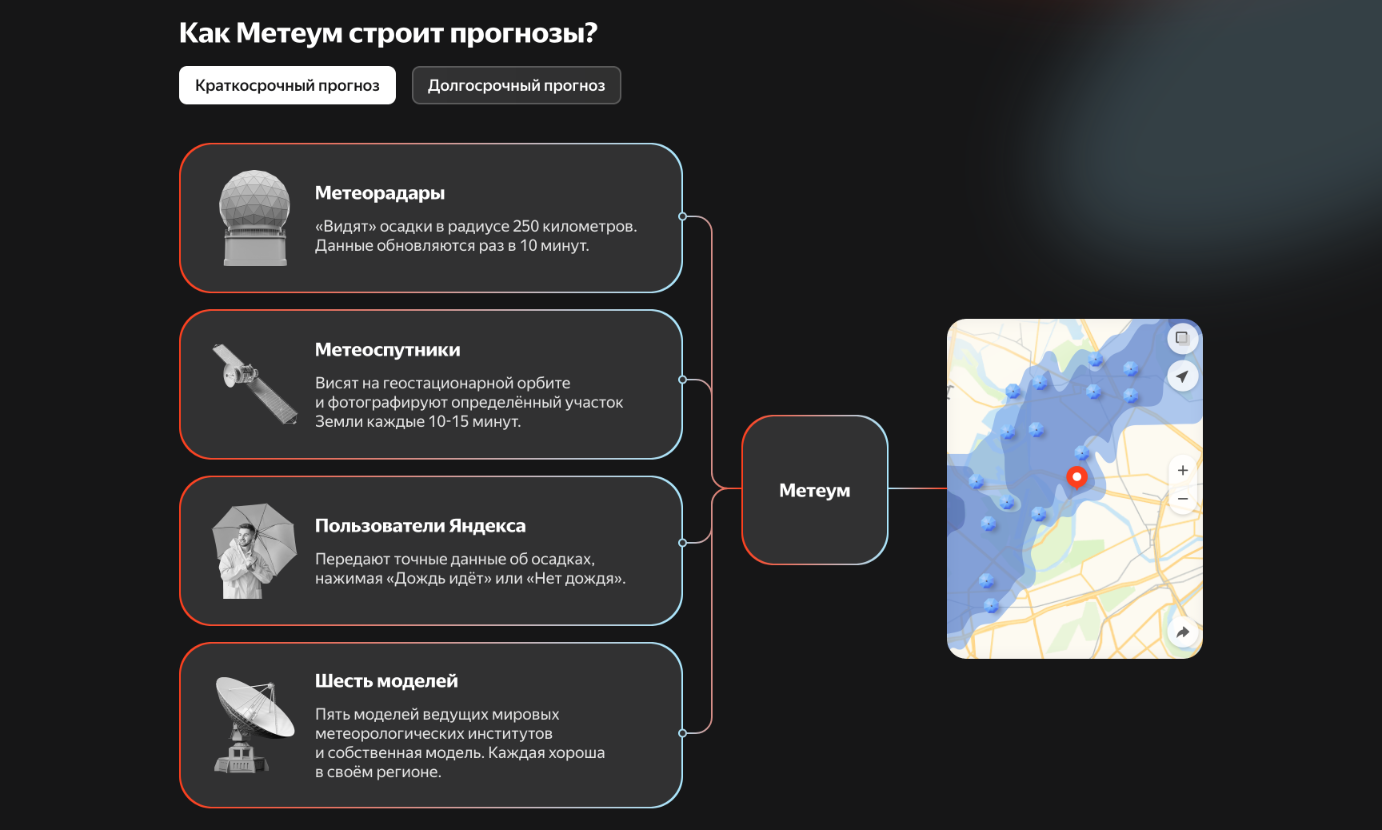
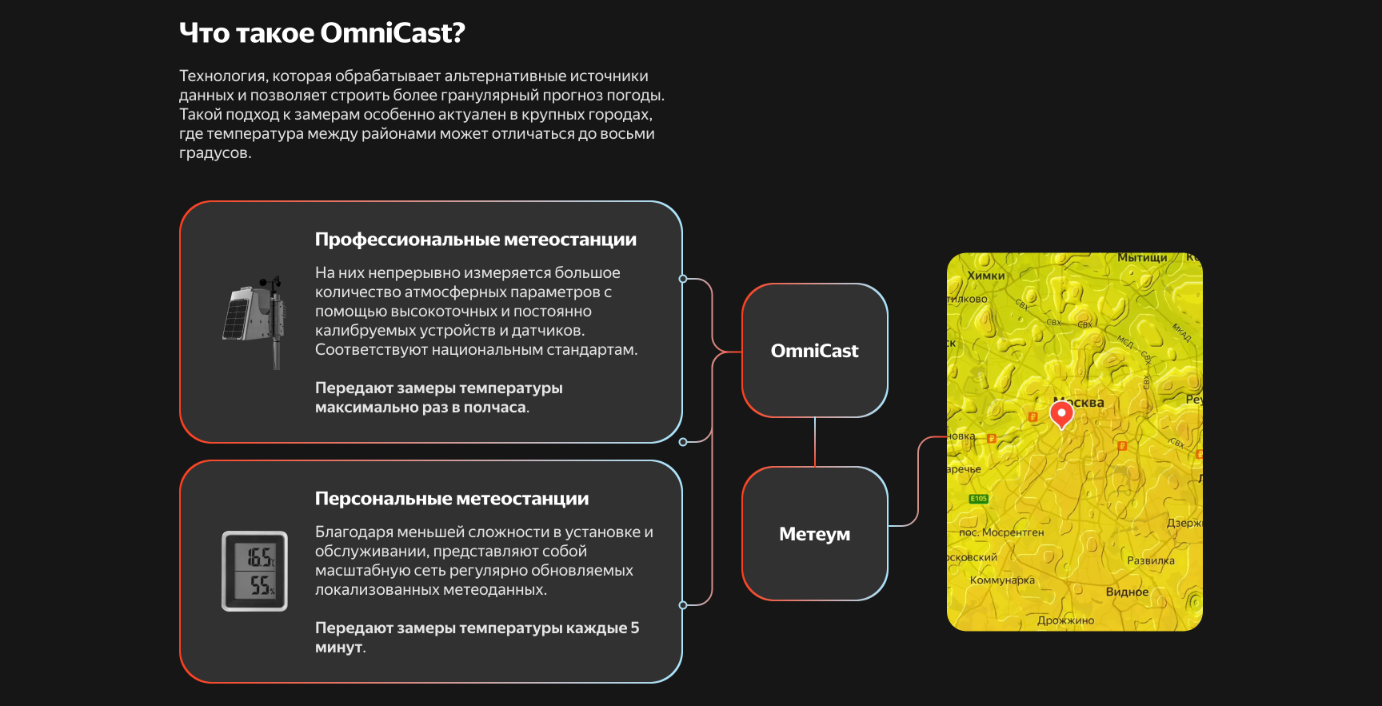
Мда, ну на Яндекс Погоду я возлагал особенно большие надежды, потому что… да не знаю, почему. Лет 15 назад может и правда возлагал бы, но не в 2026 году. Тем не менее, на первый взгляд смотрелось очень многообещающе: такие-то у них там технологии Метеум и OmniCast, с такой-то красивой страничкой (простите, с лендингом):
И зовут скорее подключать свою станцию, чтобы ты тоже мог внести посильный вклад в такое большое общее дело на благо всех пользователей:
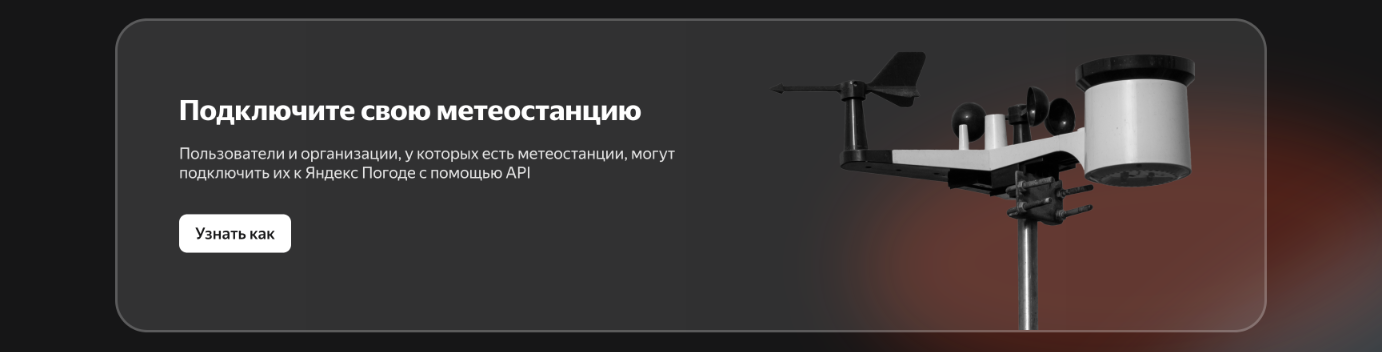
Ну я, конечно, побежал перешёл по Узнать как ссылке, а там говорят, что для получения ключа API надо сначала авторизоваться с Яндекс ID. Я хотел было создать новый на Васю Иванова, потому что мне не упало палить свои реальные координаты на основном аккаунте, но там оказалось, что для регистрации нужен номер телефона, а я и забыл.
Вот на этом моменте я уже (решительно) передумал делиться своими погодными данными (и координатами) с Яндексом, но решил всё-таки пройти дальше по этому пути хотя бы просто из интереса посмотреть, как молодцы ребята умеют.
На основном аккаунте у меня (к сожалению, но иначе вроде нельзя) уже привязан номер телефона, так что ключ API я на него получил. Далее надо с ним зарегистрировать свою станцию таким запросом:
$ curl -X "POST" "https://api.weather.yandex.ru/user_stations/stations/" \
     -H 'Content-Type: application/json' \
     -H 'X-Yandex-Weather-Key: ТВОЙ-КЛЮЧ-АПИ' \
     -d $'{
  "external_id": "ТВОЙ-ИД",
  "name": "ТВАЁИМЯ-СТАНЦИИ",
  "latitude": ШИРОТА,
  "longitude": ДОЛГОТА,
  "altitude": ВЫСОТА
}'
В ответ вернётся такое (со статусом 200):
{
    "ID": "ТУТ-НАЗНАЧЕННЫЙ-ИД-СТАНЦИИ",
    "updated_at": "ТУТ-ОДИН-И-ТОТ-ЖЕ-ТАЙМСТАМП-ДВА-РАЗА",
    "created_at": "ТУТ-ОДИН-И-ТОТ-ЖЕ-ТАЙМСТАМП-ДВА-РАЗА",
    "user_id": "dummy_user_id",
    "external_id": "ТВОЙ-ИД",
    "name": "ТВАЁИМЯ-СТАНЦИИ",
    "latitude": ШИРОТА,
    "longitude": ДОЛГОТА,
    "altitude": ВЫСОТА
}
Почему user_id возвращается как dummy_user_id - я хз. И кстати, если отправить в X-Yandex-Weather-Key любой случайный бред или вообще отправить запрос без этого заголовка - ответ сервера всё равно будет со статусом 200 (и user_id будет всё так же dummy_user_id).
А ещё кстати, повторная отправка такого же запроса со всеми теми же идентификаторами и координатами тоже возвращает результат со статусом 200 и при этом с новым значением ID каждый раз, а ведь этот ID вообще-то должен быть идентификатором станции, то есть это что, каждый последующий идентичный запрос создаёт новую станцию? Ну это явно какие-то олимпиадники писали.
Хорошо, вот я выполнил 10 таких запросов, например потому что я тупой, а значит создал 10 разных станций (идентификаторы же разные), и теперь хочу удалить 9 из них. Где мне посмотреть все зарегистрированные на меня станции? Где такой метод API? Такого метода API нет. Ну ладно, даже если бы я выполнил запрос создания станции только один раз, то есть лишние мне удалять не надо, но вот я что-то как-то отвлёкся и, скажем, перезагрузил комплюктер зачем-то, и теперь результата выполнения этого запроса у меня нигде не осталось - так это что, я теперь никак не могу узнать идентификатор моей созданной станции? Или хотя бы просто убедиться, что я реально её создал и что она существует? Ну ладно в API такого метода нет, но можно их посмотреть хотя бы где-то в профиле на сайте, я же авторизовался аж с целым Яндекс ID и привязанным номером телефона? Но нет, нельзя, ничего такого нигде в профиле пользователя нету. Это как вообще? Вы по каким олимпиадам-то призёры там?
Океюшки, допустим, я не проепотерял идентификатор своей созданной станции, и я верую, что она существует, и готов слать погодные данные. Запрос будет такой:
$ curl -X "POST" "https://api.weather.yandex.ru/user_stations/measurements/" \
     -H 'Content-Type: application/json' \
     -H 'X-Yandex-Weather-Key: ТВОЙ-КЛЮЧ-АПИ' \
     -d $'[
  {
    "station_id": "ТУТ-НАЗНАЧЕННЫЙ-ИД-СТАНЦИИ",
    "dt": 1782053081,
    "temperature": 18.7,
    "humidity": 68,
    "pressure": 998,
    "wind_speed": 1.1,
    "wind_gust": 2.4
  }
]'
И снова в X-Yandex-Weather-Key может быть любой бред, а также этот заголовок может просто отсутствовать - ответ всё равно будет со статусом 200. Также можно не указывать dt и… да что там другие поля, тут аж station_id можно выкинуть к херам! Яндексу безразлично, чего вы там шлёте и для какой станции, потому что данные всё равно уходят куда-то в никуда, и ответ на запрос всегда будет вот такой (со статусом 200, разумеется):
HTTP/1.1 200 OK
Connection: Close
Content-Length: 0
Set-Cookie: ТУТ-ОДНА-КУКА
Set-Cookie: ТУТ-ДРУГАЯ-КУКА
Set-Cookie: ТУТ-ТРЕТЬЯ-КУКА
Set-Cookie: ТУТ-ЧЕТВЁРТАЯ-КУКА
Set-Cookie: ТУТ-ПЯТАЯ-КУКА
Date: Mon, 15 Jun 2026 11:29:16 GMT
X-Req-Id: ИД-РЕКВЕСТА
Посмотреть историю своих отправлений нигде нельзя, вот тут человек ещё два года назад спросил - “отправляю данные как в чёрную дыру” - на что представитель Яндекса обещал подумать, но вот, видимо, так ни до чего и не додумались до сих пор, по-прежнему всё уходит в чёрную дыру. Короче, ни за чем сто лет Яндексу не нужны никакие данные от пользовательских станций.
Я ещё подумал, ну наверное это просто я криворукий, не осилил API из двух методов, дай хоть посмотрю на станции других пользователей, ведь за столько лет по-любому несколько тысяч ну или хотя бы сотен станций добавили и можно на них взглянуть. Но вот надо же, что-то я не нашёл нигде такой карты со станциями, как это сделано во всех других погодных сервисах. Ладно карта, хотя бы страничку убогую со списочком хоть каких-то станций от живых пользователей - но нет, и такого тоже нету. Так а что есть-то вообще? Нахузачем было этот “API” для “пользователей” городить и рекламировать, если в него ни отправить ничего нельзя, ни посмотреть из него ничего нельзя?
На этом как бы всё, но я ещё попытался хоть подать им знак, а то может они не знают, что у них вместо API онлайновый /dev/null. Для обратной связи у них есть вот такая страница:

…с формой под спойлером, Карл! И чтобы отправить великому Яндексу записочку, помимо прочих данных в этой форме:
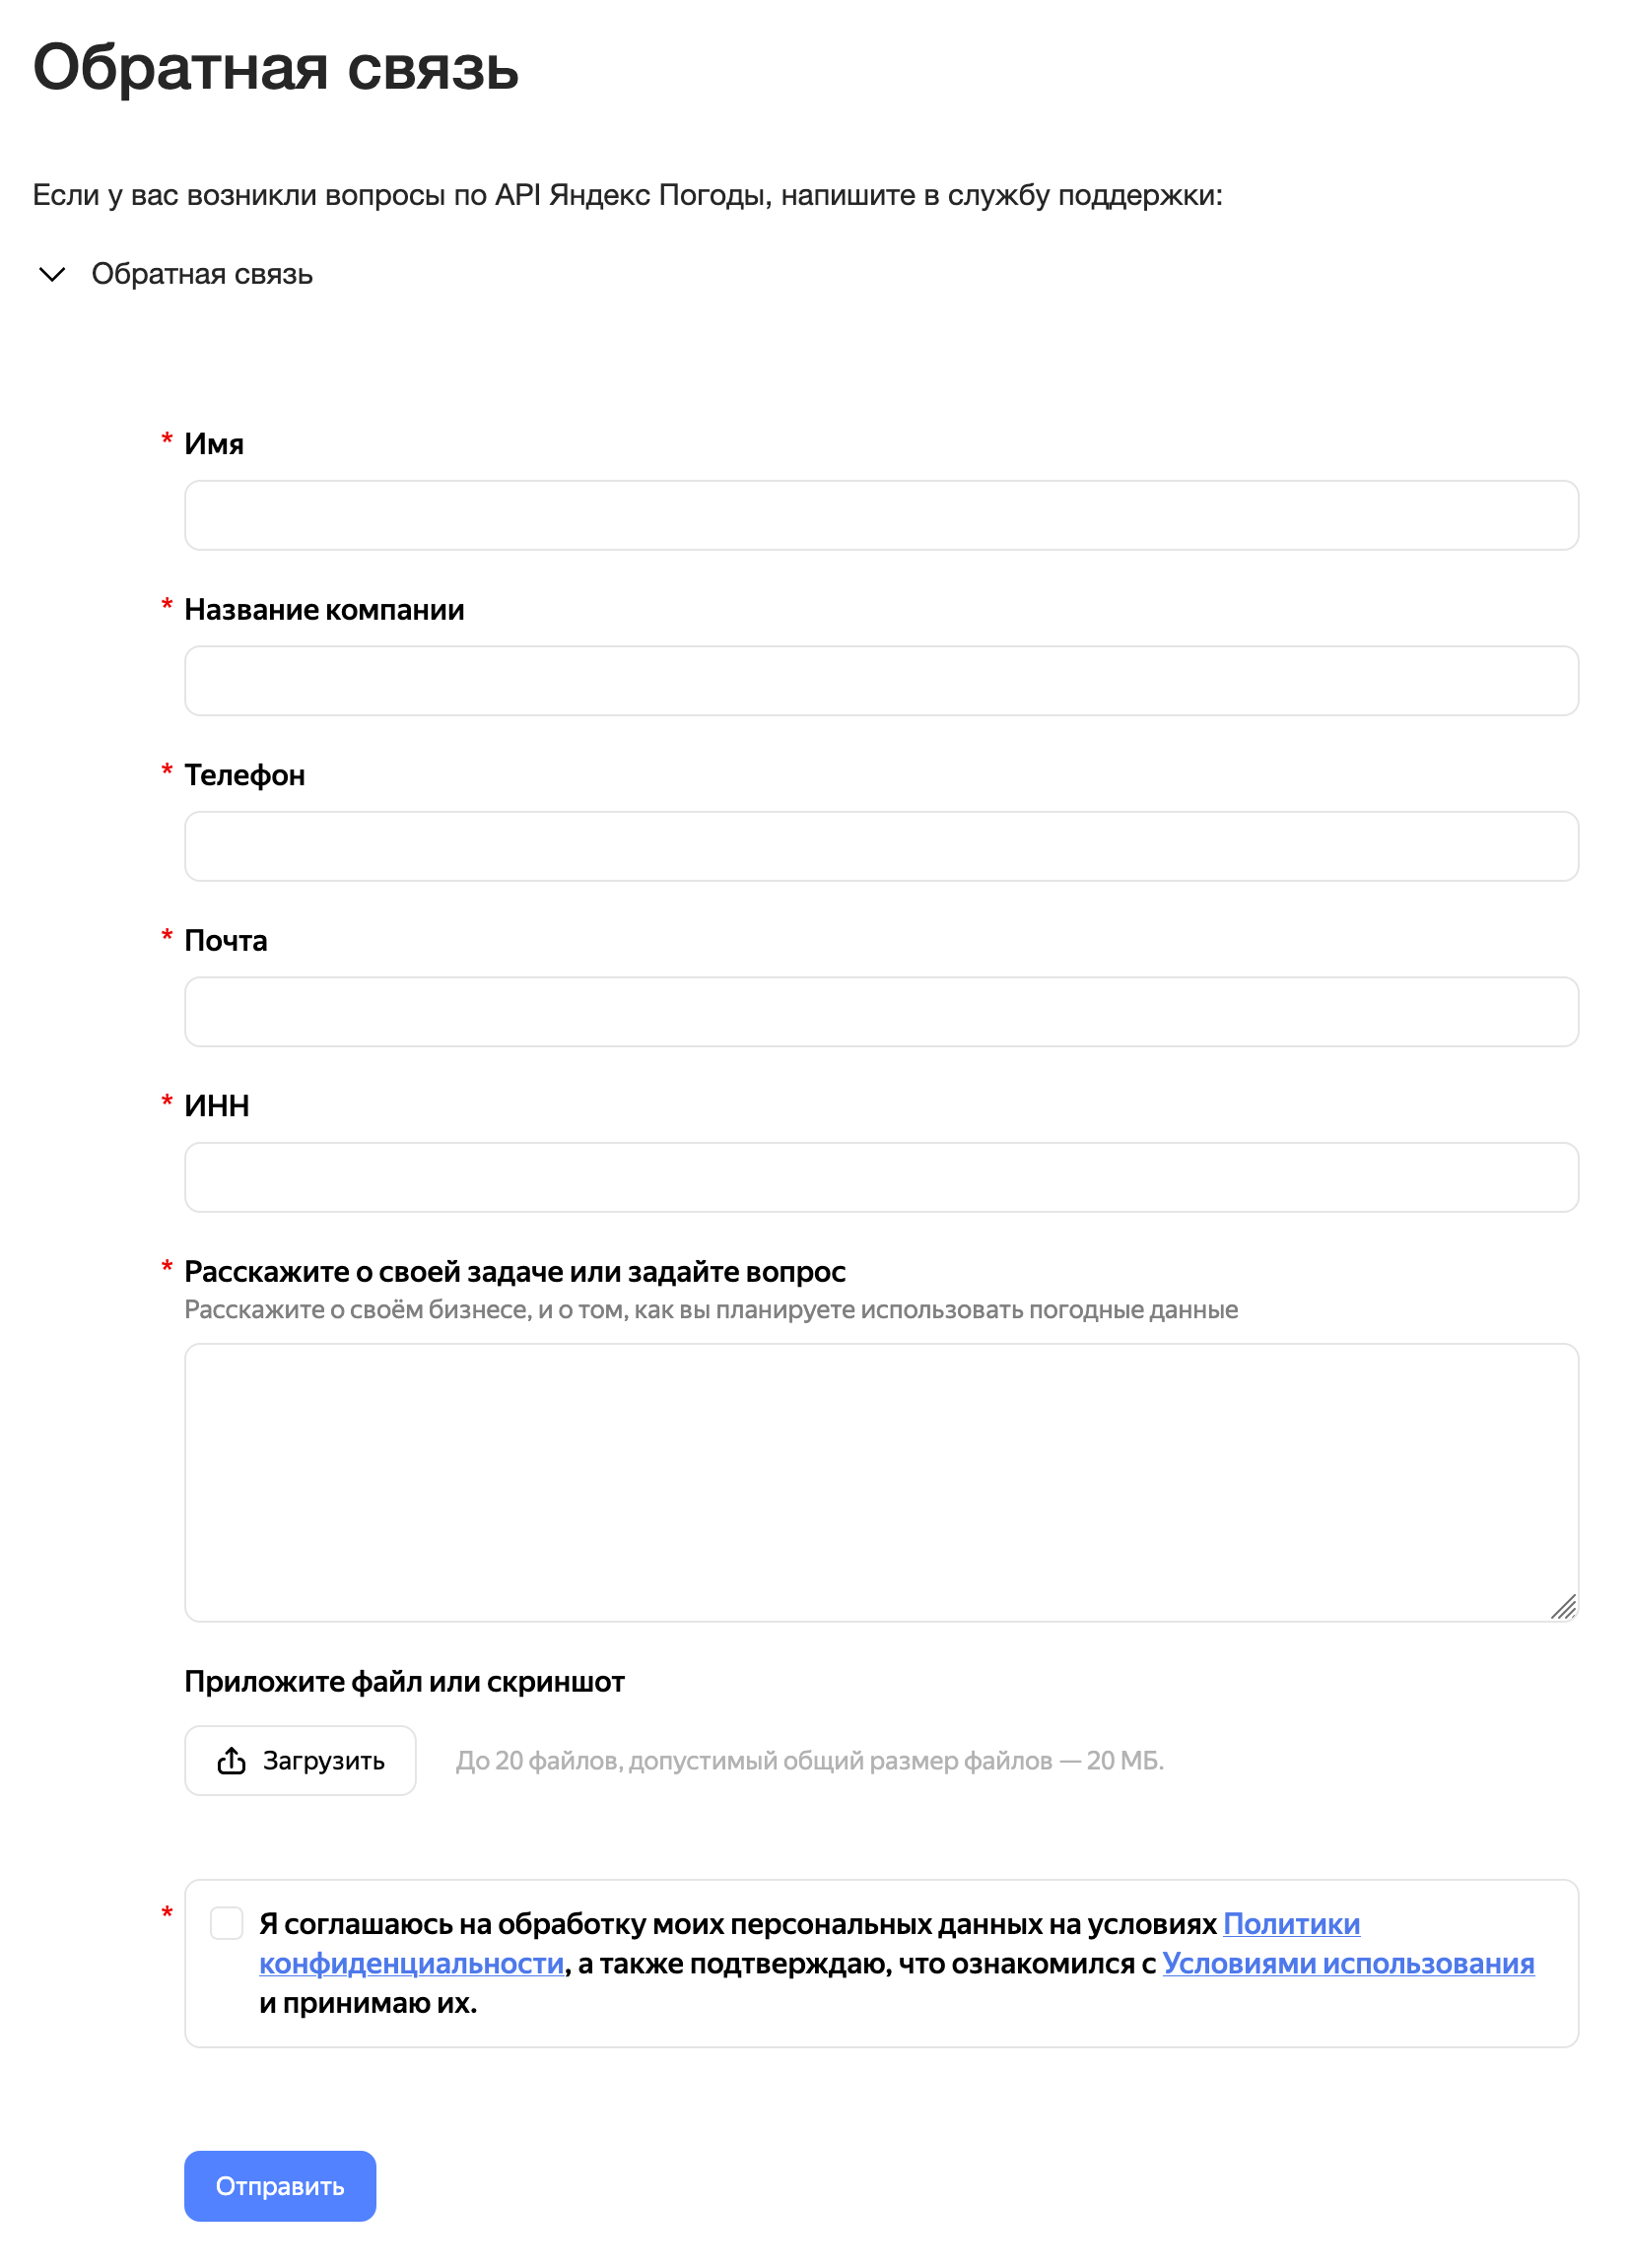
от пользователя дрожащего требуется (обязательные поля с красной звёздочкой (хотя она тут на всех полях)) указать:
- телефон
- название компании
- ИНН
Ясно, в общем, на хуй и в пизду.
Other services
There likely are many more public weather services where you could submit your data too, and different countries probably have their local alternatives.
If I was to share my weather data with some more services, my next candidate would be Public Monitoring Project (опять Яндекс?), but I do have to stop at some point, and for now this is it.