TeamCity Prometheus metrics in Grafana
Since we added a Grafana instance to our infrastructure, we started visualizing absolutely every single thing with it. So no wonder that eventually we turned our eyes to TeamCity.
In 2019.2 release TeamCity started exposing its metrics in Prometheus format, and that’s how Grafana can get those, as Prometheus is one of its supported data sources.
My environment:
# lsb_release -a
Description:    Ubuntu 18.04.4 LTS

# grafana-cli --version
Grafana CLI version 7.0.5
TeamCity user with access to metrics
First you need to add a TeamCity user with access to View usage statistics. For that you need to be logged-in to TeamCity as administrator.
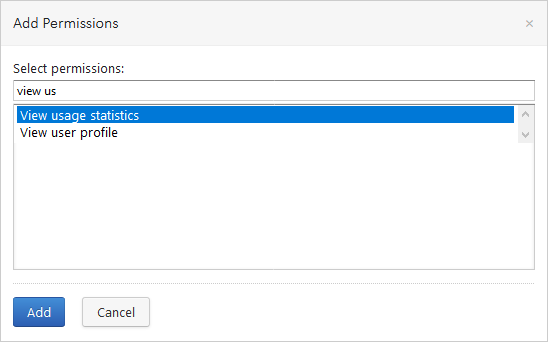
Create a new role, call it Monitoring or something. Add the View usage statistics permission to it:
Now create a new user, call it grafana and assign this new role to it:
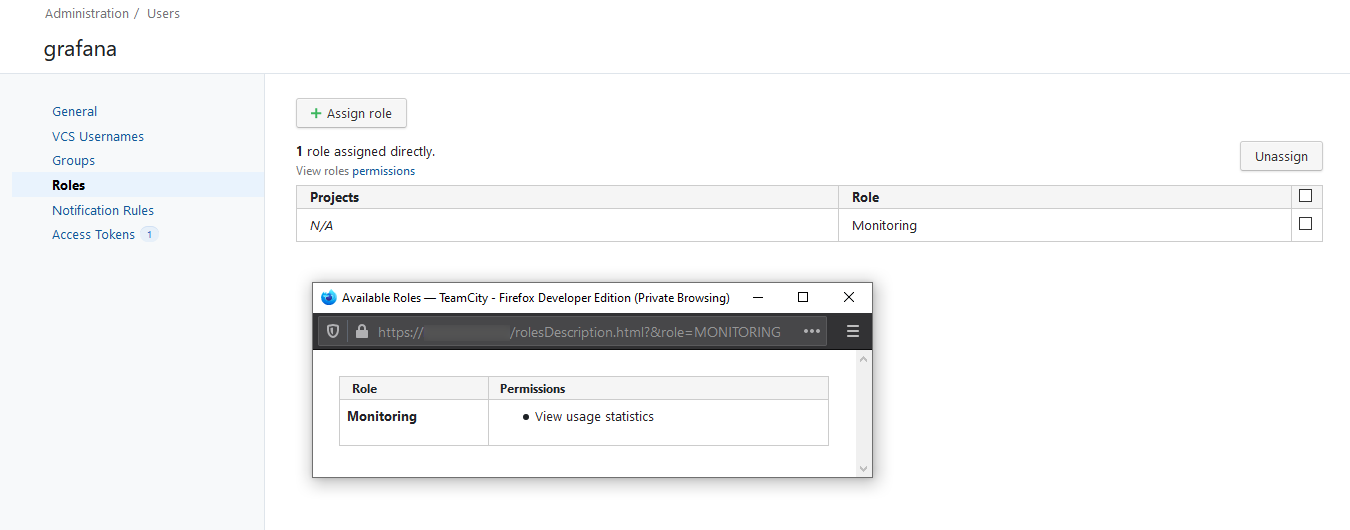
Also add an access token to this user.
Arranging a threesome
How to make everyone friends: Grafana, TeamCity and spanish inquisition Prometheus.
Adding data source to Grafana, failed attempt
So, we have a user with required access, we have the metrics endpoint, so the next steps are easy to guess, aren’t they? Go to Grafana and add a Prometheus data source for TeamCity, right?
Let’s do it then. Set the metrics endpoint, fill user login and password (what then was that access token for?) and that should be it.
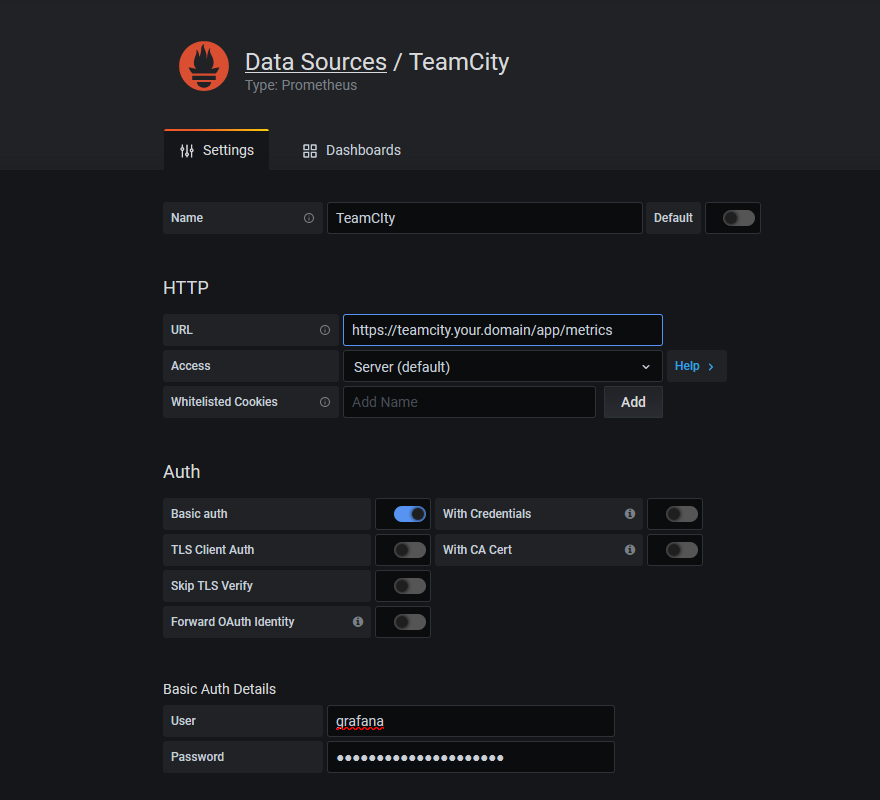
Well, no, as you will get HTTP Error Not Found error:
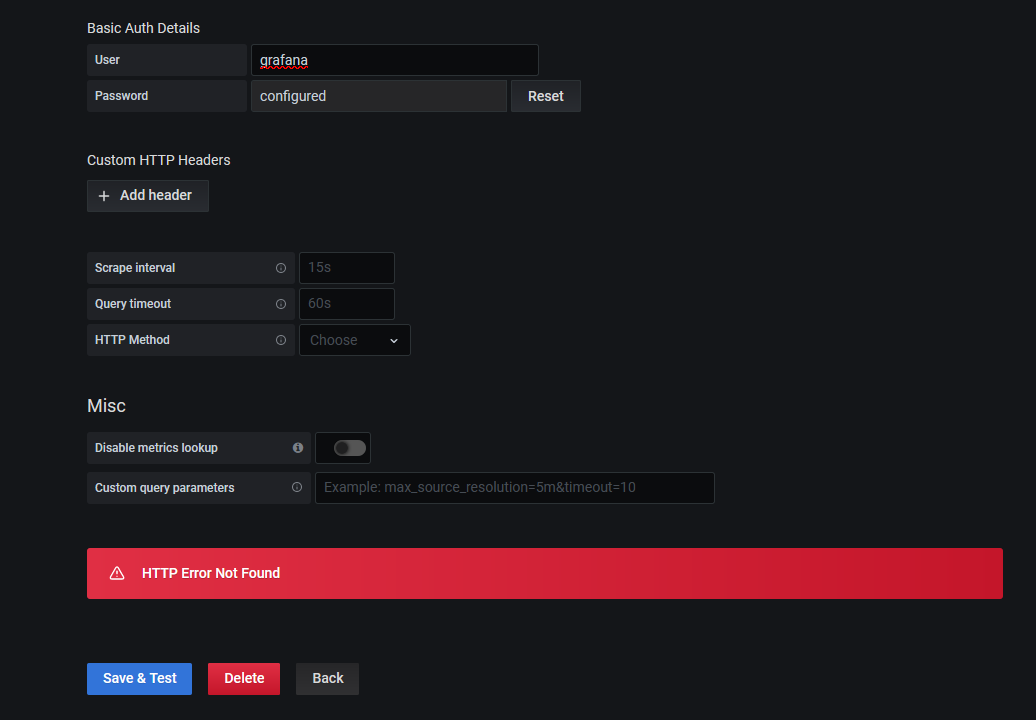
And you know why? Because it’s not the TeamCity endpoint what you need to add here!
Here’s how it actually should work:
- Prometheus is not just metrics format, it’s an actual software, so first you need to run a Prometheus instance somewhere
- Then you add your TeamCity metrics endpoint to that Prometheus instance for monitoring (scraping)
- And only then you add this Prometheus instance to Grafana as a data source
It’s almost hilarious, how at first I got carried away by the flow, as everything seemed to be so straightforward, so I missed the Prometheus part completely. In my defense I can say that I have never worked with Prometheus (or even knew about its existence, for that matter).
But okay, let’s do it properly.
Setting up Prometheus
The installation process is described in the documentation, but here’s my version anyway.
So, you download the latest release and unpack it to some folder where it will be working from. I chose /var/www/prometheus.
Edit the config file (prometheus.yml):
global:
  scrape_interval:     15s
  evaluation_interval: 15s

scrape_configs:
  - job_name: 'TeamCity'

    # here goes the TeamCity endpoint
    metrics_path: /app/metrics

    # that's how you can set URL parameters (query string)
    params:
      experimental: ['true']

    scheme: https

    bearer_token: THE-TOKEN-YOU-CREATED-IN-TEAMCITY

    static_configs:
    - targets: ['teamcity.your.domain']
Pay attention to the number of spaces in the beginning of the lines (nesting level), as this thing is quite sensitive to it.
By default TeamCity doesn’t expose all the metrics, as some of them are experimental. If you want to get all the metrics, you need to use the /app/metrics?experimental=true endpoint. And the way you specify that in Prometheus config is by setting the params value, like it is shown above, because it is a list. Quite obvious, innit.
This is it, Prometheus is ready to run. One would say, that was too easy. I, for one, was curious to know where the data will be stored, as there is nothing in this configuration pointing to any database. But apparently it is okay, so the configuration is really done.
But let’s also make a proper service for it. Create a new user for running Prometheus:
# adduser \
   --system \
   --group \
   --disabled-password \
   --home /home/prometheus \
   prometheus
Make it owner of the Prometheus files:
# sudo chown -R prometheus:prometheus /var/www/prometheusAnd add a new systemd service (/etc/systemd/system/prometheus.service):
[Unit]
Description=Prometheus

[Service]
WorkingDirectory=/var/www/prometheus/
ExecStart=/var/www/prometheus/prometheus --config.file=prometheus.yml --web.listen-address="localhost:8002"
Restart=always
RestartSec=10
SyslogIdentifier=prometheus
User=prometheus

[Install]
WantedBy=multi-user.target
Note that I am binding it to localhost:8002. The plan is to run Prometheus on the same server as Grafana and hide both of them behind NGINX as a reverse proxy. That’s absolutely not necessary, it’s just my personal preference, so you can host it in any other way you want.
Why am I binding the port via command line arguments and not via config? Because, according to this, “configuration file is for options that can change dynamically. Changing the listen address is not possible on the fly”. What is the actual fuck.
Anyway, enable and start the service:
# systemctl enable prometheus.service
# sudo systemctl start prometheus.service
Since it’s binded to localhost, most likely you won’t be able to test it from your machine. But that doesn’t really matter now.
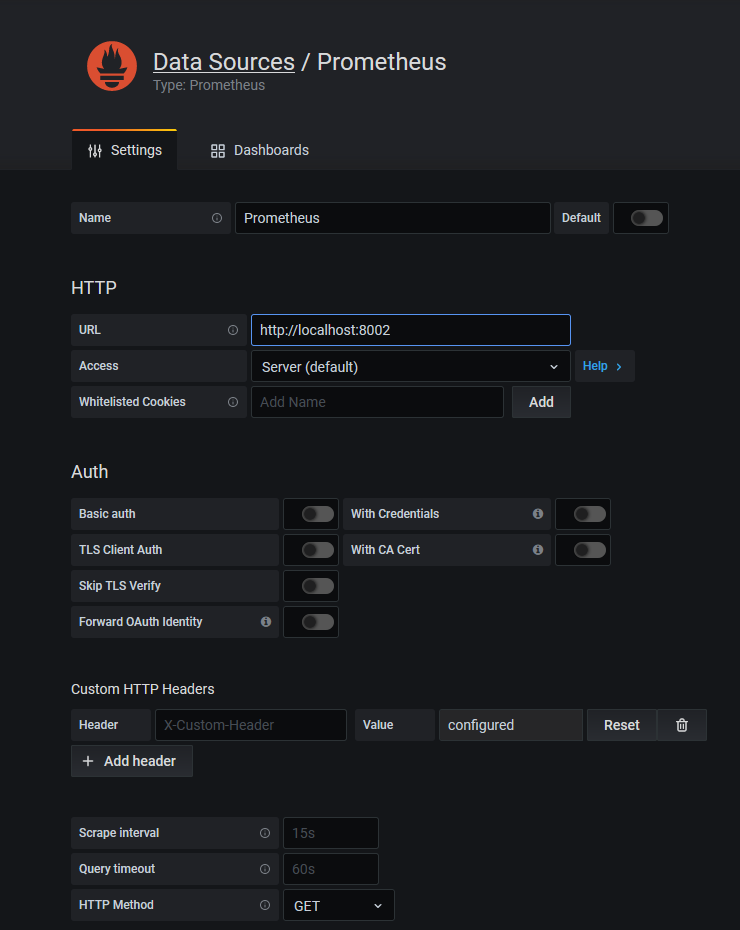
Adding the right data source to Grafana
So here’s how you add Prometheus as a data source:
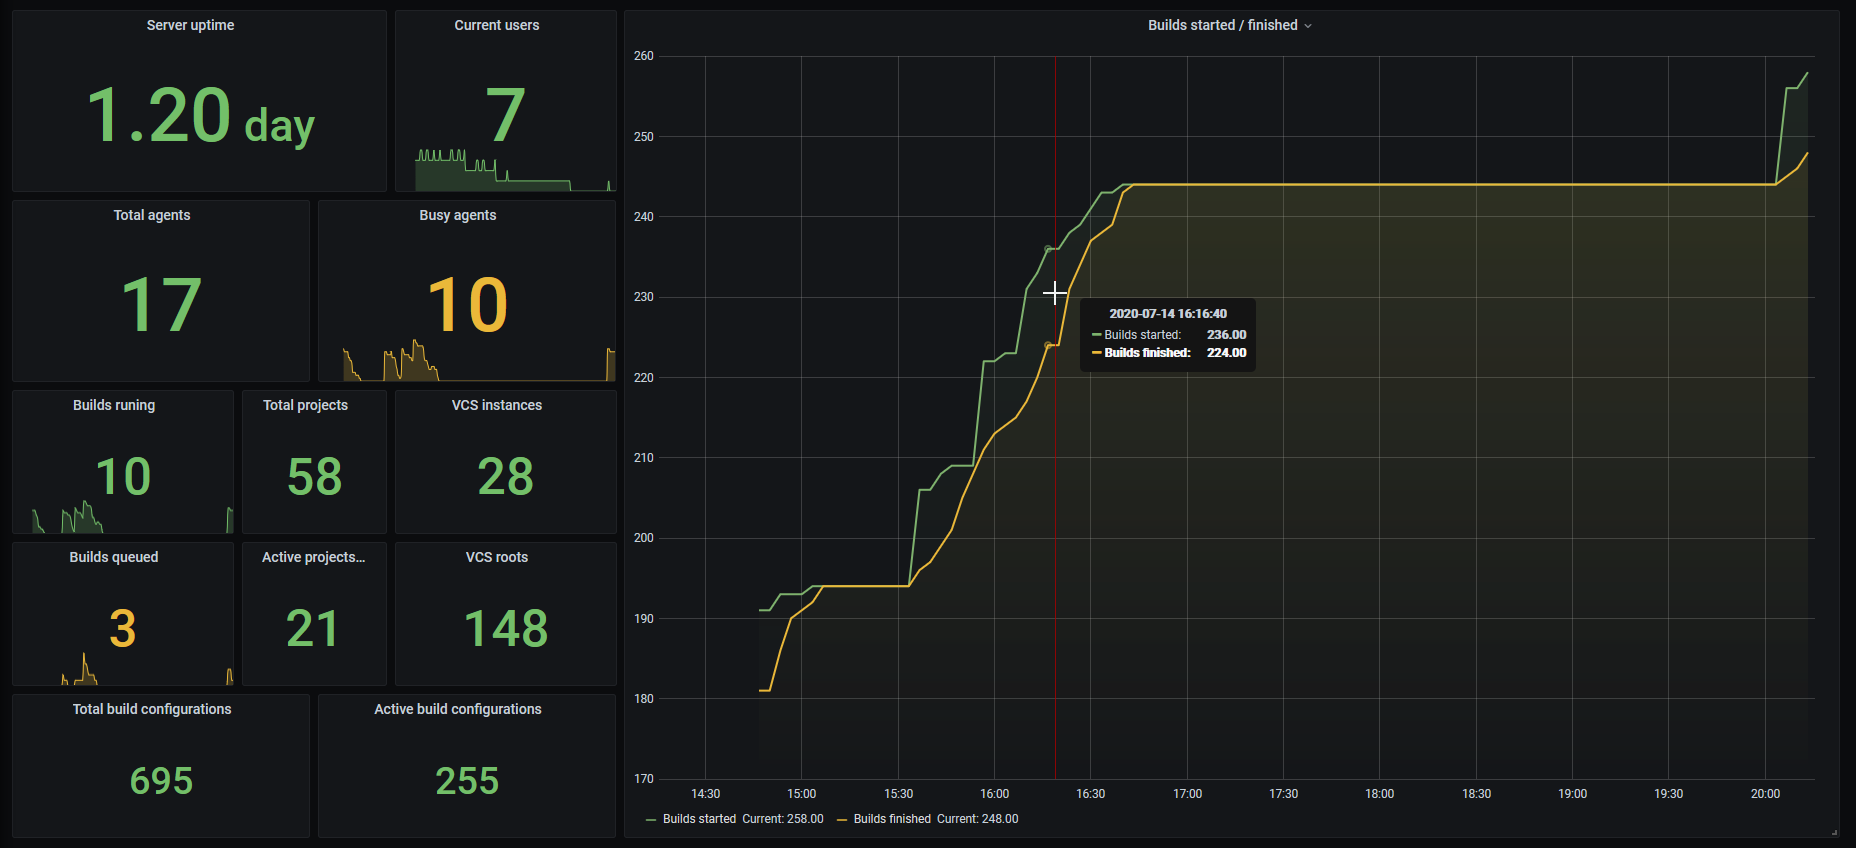
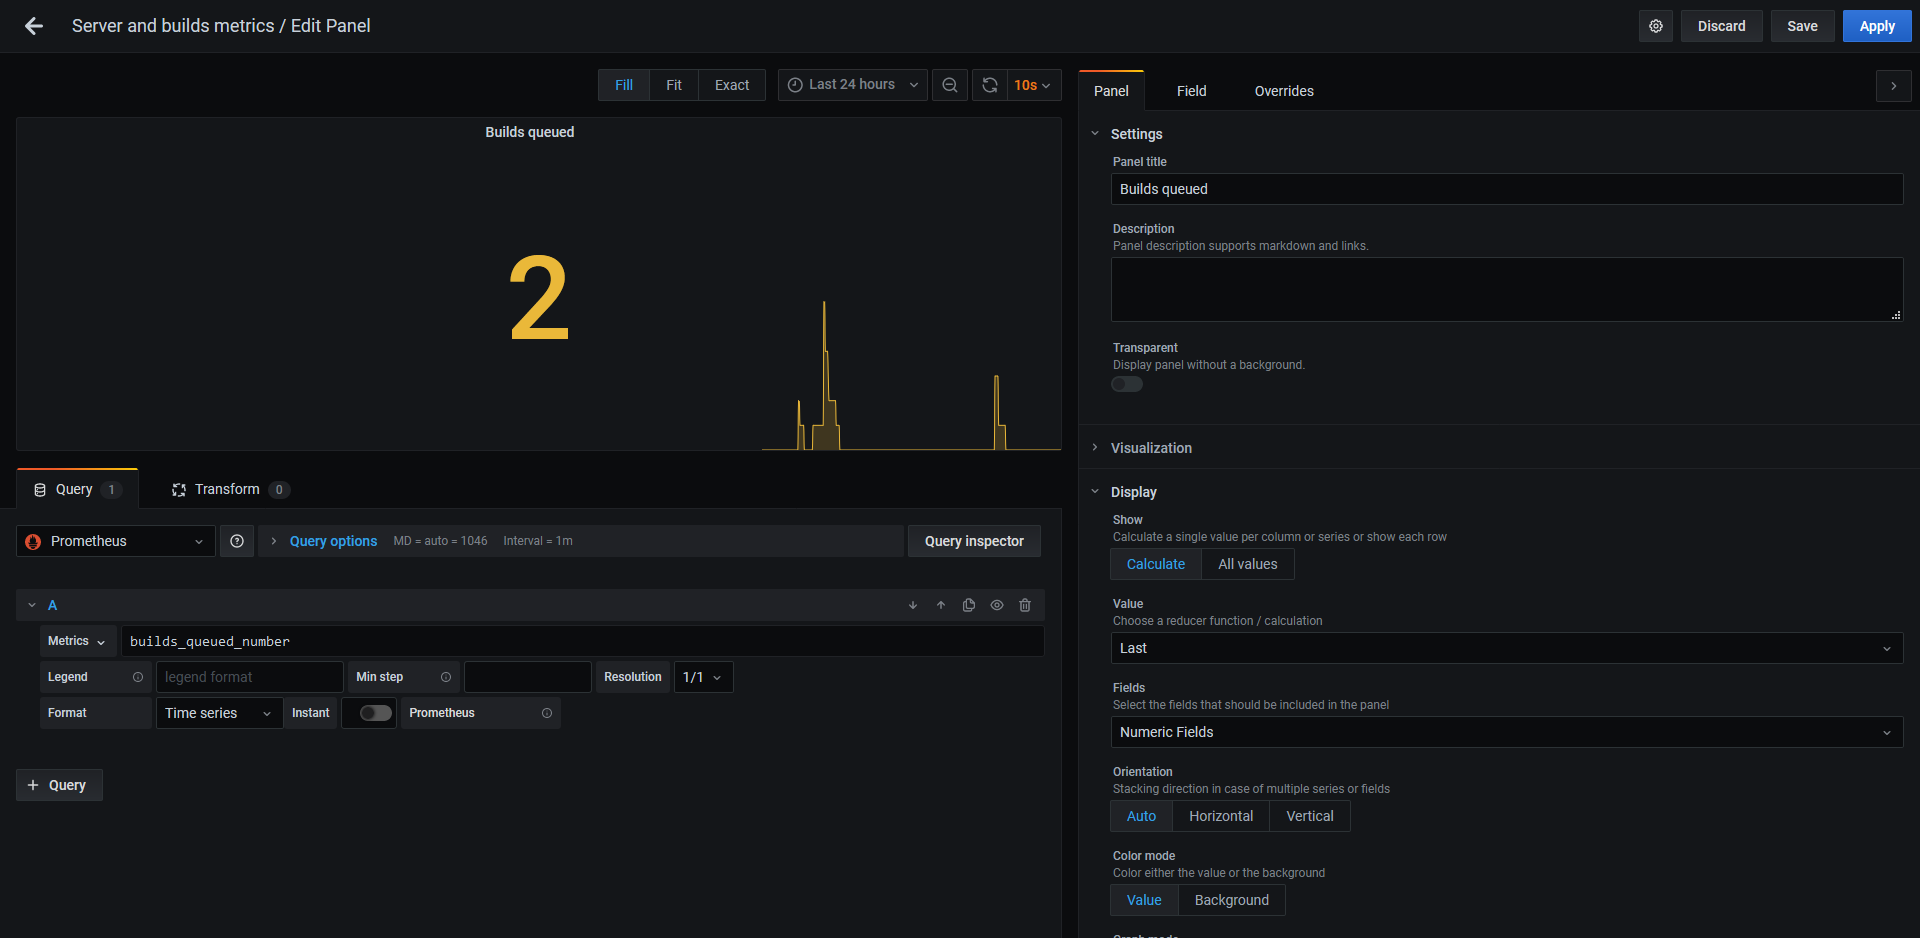
This is it. Now you can go and visualize TeamCity metrics in your Grafana dashboards:
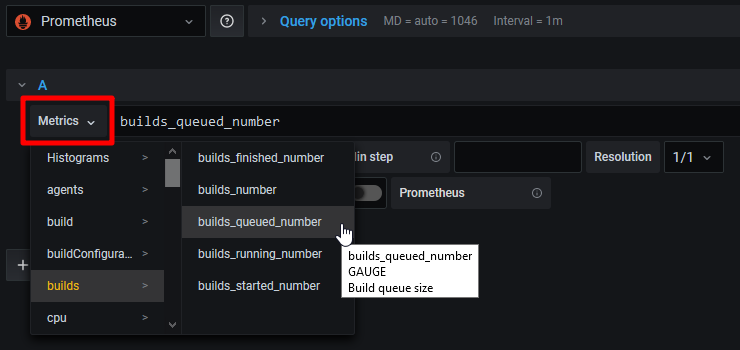
Conveniently enough, you can select metrics from the helper menu:
Running everything behind NGINX
I am not sure if we will use Prometheus for anything else, but in case we will, I exposed it via NGINX. And since in my case both Grafana and Prometheus are running on the same server, I needed to create virtual hosts for them.
So first I registered DNS records for both:
grafana.your.domainprometheus.your.domain
Hosting Grafana
Grafana config (/etc/grafana/grafana.ini):
[server]
;protocol = http
http_addr = localhost
http_port = 8001
domain = grafana.your.domain
;enforce_domain = false
;root_url = %(protocol)s://%(domain)s:%(http_port)s/
;serve_from_sub_path = false
NGINX config (/etc/nginx/sites-available/grafana):
server {
    listen 80;
    listen [::]:80;

    index index.html index.htm;

    server_name grafana.your.domain;

    location / {
        proxy_pass http://localhost:8001/;
    }
}
Hosting Prometheus
Prometheus config you already saw, and here’s NGINX config (/etc/nginx/sites-available/prometheus):
server {
    listen 80;
    listen [::]:80;

    index index.html index.htm;

    server_name prometheus.your.domain;

    location / {
        auth_basic "Prometheus";
        auth_basic_user_file /etc/nginx/.htpasswd-prometheus;
        proxy_pass http://localhost:8002/;
    }
}
Since Prometheus doesn’t have any authentication, I would recommend you to rely at least on Basic authentication from NGINX. Here’s how you can create a password mentioned in the config about:
# htpasswd -c /etc/nginx/.htpasswd-prometheus prometheusDon’t forget to set these credentials in Grafana for the Prometheus data source. And while you are there, you might also want to change the URL from http://localhost:8002 to http://prometheus.your.domain.